

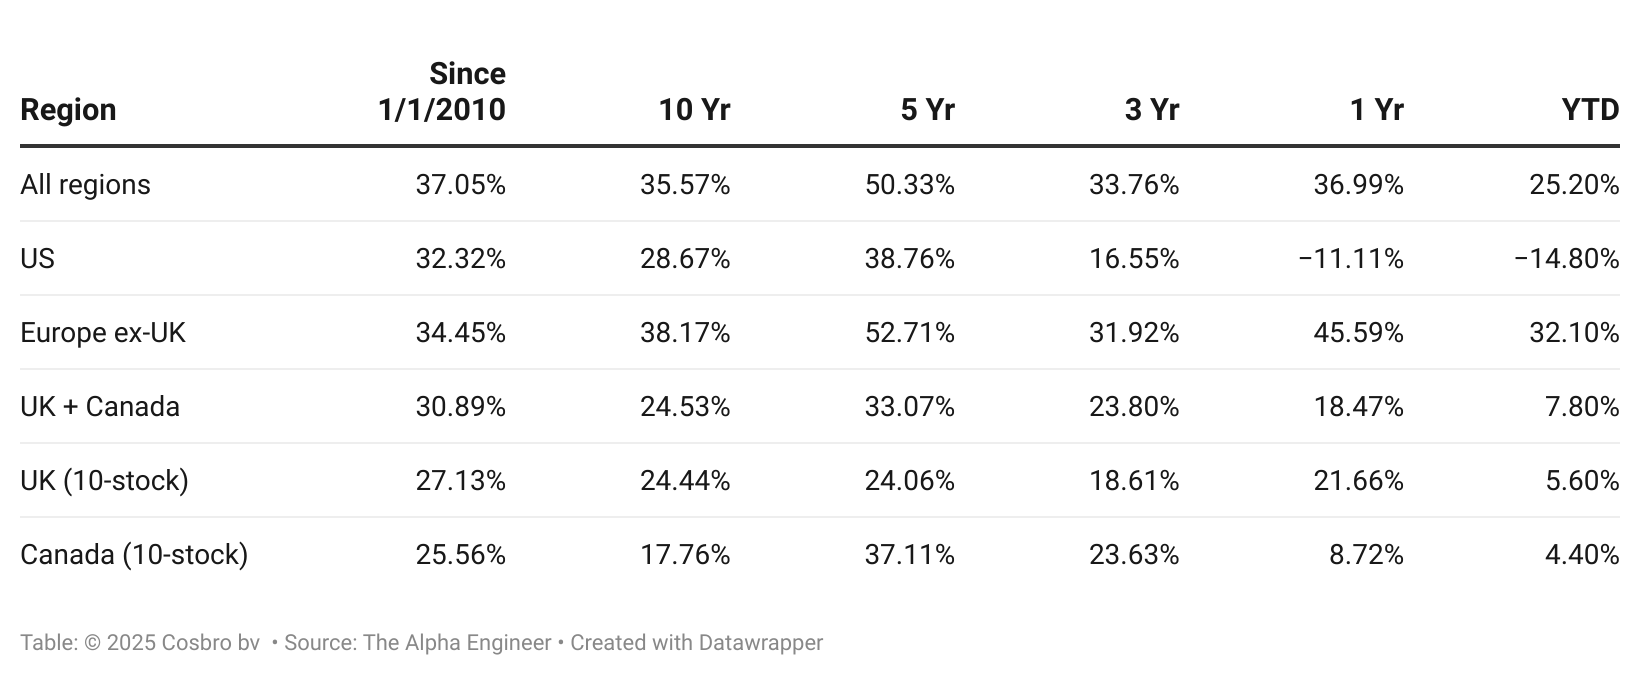
Back-testing results from 1 jan 2010 through 5 May 2025 (inc 1% trade friction)
Why I Ran These Tests
I wanted to stress-test the Alpha Engineer stock-picking model across a variety of market ecosystems—from an "all regions" universe of nearly 3,800 names down to niche 10-stock portfolios in the UK and Canada.
The goal was twofold:
Robustness: Does the factor blend—dominated by small market cap, value factors, fundamental and price momentum factors, and quality screens—still work when we confine it to specific geographies?
Practicality: How much does portfolio breadth (or the lack thereof) alter returns, risk and trading costs once we bake in a healthy 1% per-trade friction?
I back-tested six universes:

Sell and buy rules are the same as The Alpha Engineer Model Portfolio. A position is trimmed when it drops below the 90th percentile of the global ranking. With the freed-up funds, the top ‘liquid’ stock (>$50K avg daily liquidity and >$0.5 price) that is not yet in the portfolio is purchased. Portfolio size is limited to 20 stocks to reduce turnover for the smaller universes. For the two smallest universes (UK only and Canada only), I had to limit the portfolio to 10 stocks to manage churn.
The Numbers
1 | Annualised Trailing Returns (net %)
2 | Risk Profile & Turnover

3 | U.S. "Outlier Effect"
I removed two +1,000% moon-shots (KOSS & ZDGE) from the baseline U.S. run to avoid overstating typical performance.

The outliers add roughly 6-8 percentage points of CAGR but double volatility, knocking the Sharpe lower even as the Sortino ticks higher (bigger upside moves improve the upside-downside asymmetry).
Want the complete backtest reports? Detailed reports with yearly performance breakdowns, benchmark comparisons, current stock holdings, sector allocations, and comprehensive trade statistics are available exclusively for paid subscribers.
A Quick Primer on the Risk Metrics
For those new to quantitative investing, here's what these risk measures mean for your portfolio:
Standard Deviation (Std Dev) — The total volatility of monthly returns. Higher numbers mean a bumpier ride, whether up or down.
Downside Deviation — Volatility of negative monthly returns only; punishes painful moves rather than joyful ones. This focuses exclusively on the "bad" volatility.
Sharpe Ratio — Annualised excess return divided by Std Dev; treats upside and downside volatility symmetrically. Generally, anything above 1.0 is considered good, above 1.5 is excellent.
Sortino Ratio — Annualised excess return divided by Downside Deviation; rewards upside volatility and therefore often runs higher than the Sharpe when returns are positively skewed. This is even more telling than Sharpe since it only penalizes downside risk.
Maximum Drawdown (Max DD) — Peak-to-trough drop during the test period; a gut-check for risk tolerance. For reference: The Alpha Engineer model portfolio (50 stocks) had a max drawdown of -36% during the same period, while the S&P 500 experienced -34%.
Turnover — Estimated percentage of the portfolio traded per year; multiplied by the 1% per-trade cost gives the rough fee drag baked into these results. Higher turnover means more trading costs.
What the Data Tells Me
1. Breadth Matters
The larger the universe, the more freedom the model has to cherry-pick top-ranked names. The All-regions test leads almost every column—and boasts the standout Sharpe (1.62) and Sortino (2.22)—suggesting that factor robustness thrives on variety and that its risk-adjusted return profile is superior.
This makes intuitive sense: when we can fish in a larger pond, we have more opportunities to catch the biggest fish. My model can select the very best stocks from the global ranking regardless of which country they come from.
2. Narrow Pools — Two Different Stories
Canada: With only 354 names and a 10-stock limit, turnover explodes to ~259% p.a. and risk-adjusted returns suffer. The smaller universe means fewer high-quality options, forcing more frequent trading as rankings shift.
United Kingdom: Capping the book at 10 names does cut turnover to 146% p.a. but returns trail broader universes because the very best global-ranked stocks are simply not available within the UK market. However, the UK portfolio still delivers respectable performance with lower churn.
3. Understanding the U.S. Market Dynamics
The dynamic U.S. micro- and small-caps market generally screens pricier on value factors than Europe and exhibits less momentum persistence (more efficient market) and therefore stocks slip below the 90th-percentile sell bar sooner, driving a 262% annual turnover.
The trade-off: access to occasional mega-winners (if you are lucky). This explains the dramatic difference between the baseline and outlier-inclusive numbers. These "lottery tickets" can turbocharge returns but at the cost of higher volatility.
It's worth noting that U.S. returns have also benefited from the strong bull markets over the past 15 years that have lifted all boats, helping deliver great returns even when value and momentum factors appear less attractive compared to other markets. This broader market strength can compensate for the higher churn and potentially lower factor efficiency in the U.S. universe.
Recent market conditions have particularly challenged U.S. stocks, with a soft market for microcaps since the 2021 Covid boost and recently new tariff policies impacting performance of small company stocks considerably. This explains the stark -11.11% one-year and -14.80% YTD figures, compared to Europe's impressive 45.59% and 32.10% for the same periods.
4. Risk-Return Sweet Spots
All country baskets clear a Sortino of 1 with a big margin even after a generous 2% round-trip cost assumption. Europe excels over the 10-year window (with a 38.17% CAGR), but the all-regions portfolio is the clear all-rounder on both absolute and risk-adjusted metrics.
The data aligns with portfolio theory: while stocks across different geographical markets maintain some correlation, this correlation is typically lower than among stocks within the same region. This reduced correlation between regional markets improves the overall risk-reward profile. Being able to select from a multi-regional pool as regional factors shift gives the all-regions approach its edge.
Observations from the Back-test
Breadth and opportunity set. The back-test data suggests that broader opportunity sets produced better risk-adjusted results; the all-regions portfolio achieved the highest Sharpe (1.62) and Sortino (2.22) ratios. Both Europe-only and US-only strategies also delivered strong historical performance. As for any investing style in stocks, a time horizon of 5 years or longer appears necessary as the US results demonstrate.
Transaction cost impact. The back-test assumed 1% per-side transaction costs. With the high turnover observed (especially in the US portfolio at 262% annually), transaction costs significantly impact net returns. For example, reducing costs from 1% to 0.5% per trade in a portfolio with 262% turnover would theoretically add approximately 2.6% to annual returns in the historical simulation.
Sell rule considerations. For single-region portfolios in the back-test—particularly the U.S. portfolio—modifying the sell threshold from the 90th to the 85th percentile will reduce turnover. My previous study on parameter optimization explores this relationship in greater detail.
Drawdown characteristics. The back-test showed that all portfolio configurations experienced significant drawdowns ranging from 40-55% peak-to-trough, generally in line with their respective local market indices. The model portfolio (50 stocks) had a max drawdown of -36% during the same period, while the S&P 500 experienced -34%.
Portfolio size in smaller markets. The back-test results for smaller regions indicate that using fewer stocks (10 instead of 20) can potentially improve returns and risk-adjusted performance metrics, although results varied significantly between regions. The UK's 10-stock model demonstrated better turnover characteristics than Canada's.
Conclusion
This back-testing study examined the Alpha Engineer model's historical performance across different geographical markets during the test period from January 2010 through May 2025. The data shows that the all-regions approach produced the strongest overall results in terms of both absolute and risk-adjusted returns.
The test results illustrate notable differences in performance between regions, with significant divergence particularly evident in recent periods. Europe's considerable outperformance over the U.S. in the most recent year (+45.59% vs -11.11%) demonstrates how regional economic conditions and policies can influence returns in different market environments.
While the model generated positive long-term results across all tested markets during the study period, the variations in performance metrics, turnover, and risk characteristics between regions highlight the potential impact of geographical diversification in a systematic investment approach.
The historical data presented in this back-test should be viewed in context, with the understanding that past performance patterns may not continue in future market conditions.
Learn more about my investing framework:
Read about my overall portfolio strategy.
See the full details of my systematic method for stock picking.
The Alpha Engineer — Investing with a quantitative edge
Disclaimer: The Alpha Engineer shares insights from sources I believe are reliable, but I can't guarantee their accuracy—data's only as good as its inputs! This content (whether on Substack, via email newsletters, X, or elsewhere) is for informational and educational purposes only—it's not personalized investment advice. I'm not a registered investment advisor, just an engineer crunching numbers for alpha. My opinions are my own and may shift without notice. Investing involves risks, including the chance of losing money. Past performance, whether from back-testing or historical data, does not guarantee future results—outcomes can vary. So, please consult your financial advisor to see if any strategy fits your situation. Full disclosure: I may own positions in the securities I mention, as I actively manage my own portfolio based on these strategies.