

Today I'm sharing supplementary research for those interested in customizing The Alpha Engineer methodology to match their specific circumstances. This sensitivity study examines how adjusting six key parameters might affect backtested performance outcomes, providing you with data to consider when implementing the strategy.
The standard methodology described in My Investment Method works well as a baseline approach for most situations. However, individual investors have different constraints—portfolio size, time availability, transaction costs, and risk preferences. This analysis allows you to explore potential adjustments based on your personal situation.
It's important to note that this research presents historical backtested results rather than individual investment advice. The data shows how different parameter configurations performed in the past, but each investor should make their own decisions about implementation based on their unique circumstances.
The Reference Point
To establish a consistent baseline for this sensitivity analysis, I've used a reference model that's nearly identical to the standard Alpha Engineer model portfolio settings, with one modification: the removal of the 60-day minimum holding period. This allows stocks to be sold after just one week if they fall below the ranking threshold.
This modification creates minimal performance difference in backtesting compared to the standard model—primarily affecting turnover rather than returns. All percentage changes discussed below are measured relative to this reference model for analytical consistency.
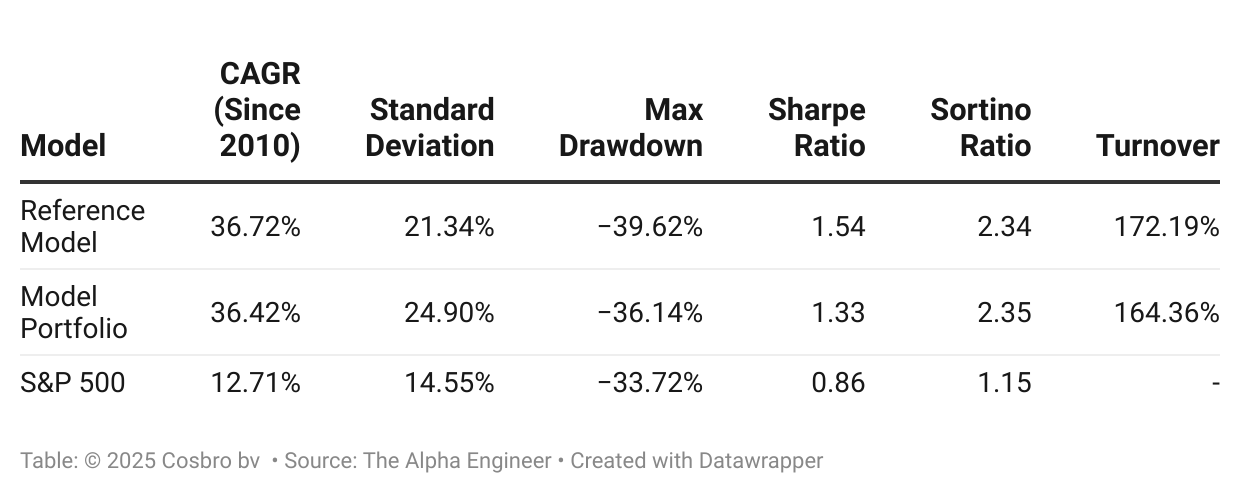
The table below shows the historical performance metrics of the three benchmark models used in this analysis:
A Note on Interpretation
This analysis explores the historical impact of different parameters based entirely on backtested data. It's crucial to understand that backtested results are not predictive of future performance. Markets evolve constantly, and strategies that performed well in the past may not continue to do so.
Due to outliers in the historical data, differences of 2-3% in performance metrics should not be considered statistically significant. The standard deviation of approximately 20-25% across most variants reflects the model's tendency to capture multibaggers—a characteristic of the methodology. The downside deviation is much closer to the S&P 500 benchmark (see spreadsheet).
This research is presented to help understand potential trade-offs when customizing parameters, not to suggest optimal settings for future implementation.
1. The Effect of Portfolio Size
The backtested data shows how varying the number of stocks in a portfolio influenced historical performance metrics. Portfolios with 15-25 stocks achieved similar CAGR (Compound Annual Growth Rate) to the reference model with 50 positions.
The historical backtested results across different portfolio sizes were:
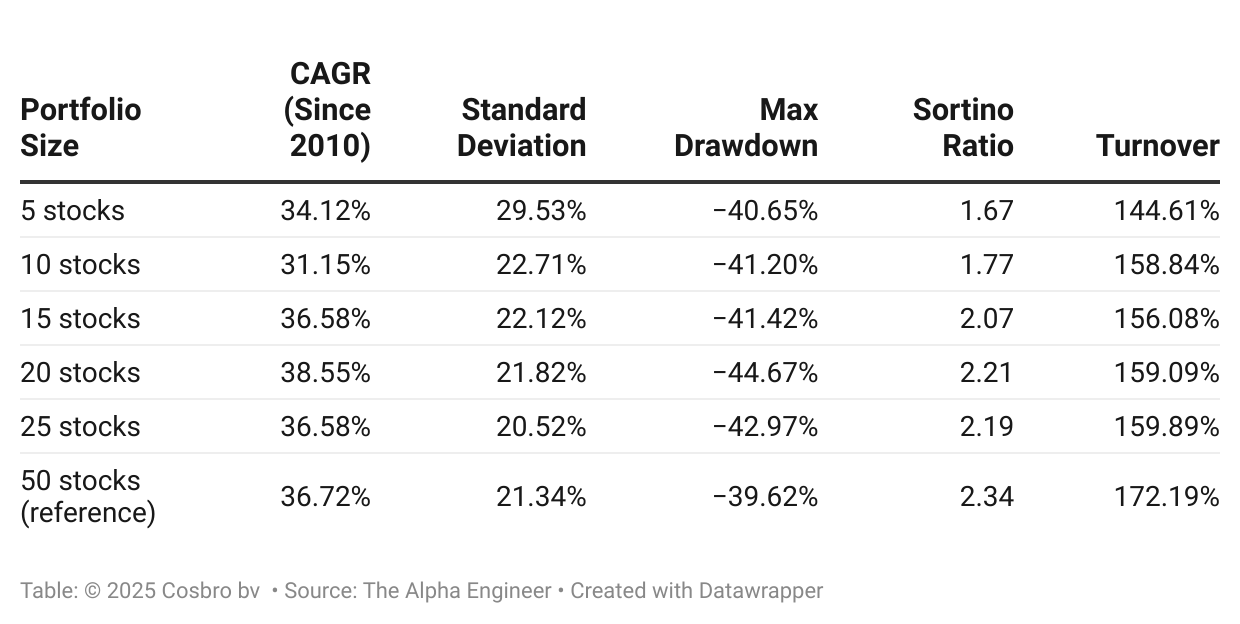
Several patterns emerged from the historical data:
CAGR remained relatively strong across most portfolio sizes (with 20-stock portfolios showing the highest returns in the test period)
Smaller portfolios (5-10 stocks) exhibited substantially higher volatility (29.53% standard deviation for 5 stocks vs. 21.34% for 50 stocks)
Risk-adjusted returns (Sortino ratio) generally improved with increased diversification
Portfolios with 15-25 stocks showed only moderately different risk metrics than the 50-stock reference model
The data suggests that historically, concentrating the strategy into 15-25 stocks maintained comparable returns while requiring fewer positions to monitor and manage.