

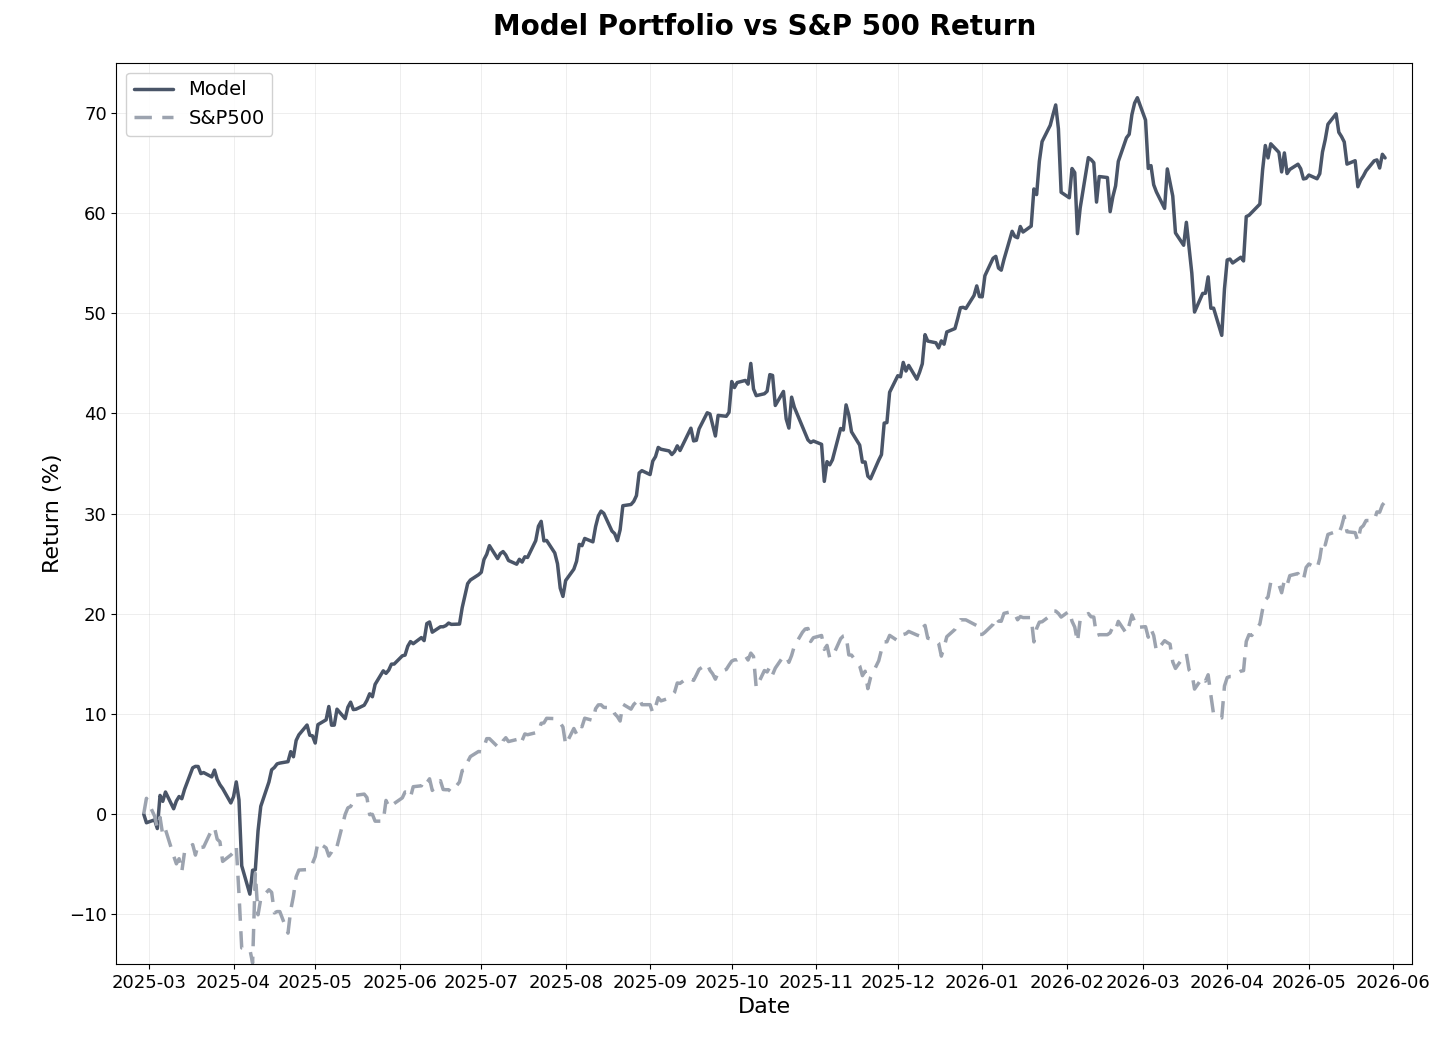
The model portfolio gained +1.2% in May against a strong +5.3% for the S&P 500, a third consecutive month of trailing a market led by large-cap and AI-related names. The two-month gap that opened in March and April widened into a third month, and the year-to-date lead the portfolio carried through April has narrowed into a small deficit. Since inception fifteen months ago, the model has returned +65.5% versus +31.2% for the S&P 500, an alpha of 34.3 percentage points, beating the benchmark in 10 of 15 months and in all five completed quarterly periods.
Year-to-date, the model now stands at +9.1% against +11.2% for the S&P 500, a deficit of 2.1 percentage points after holding a 2.1-point lead through April. The entire swing came in a single month. The deep-dive selection told a different story, posting its best month since the March correction: the average return across the eight active positions rose to +64% from +55% in April, led by a recovery in the precious metals miners even as the gold price itself eased.
Markets in May
May was a second consecutive strong month for U.S. equities, with the S&P 500 adding +5.3%. Leadership stayed concentrated in the large-cap and AI-related names that drove April’s rebound, and breadth outside that cohort remained thin. The Federal Reserve held rates steady, and markets continued to price in limited easing for the remainder of 2026 given the inflation overhang from elevated energy prices tied to the ongoing Middle East conflict.
Precious metals gave back part of April’s recovery. Gold eased from roughly $4,800 at the end of April into the $4,500–$4,600 area through May, pressured by rising U.S. Treasury yields, with the ten-year benchmark approaching a one-year high, and a firmer dollar that raised the cost of bullion for overseas buyers. The structural case stayed intact, with continued central bank accumulation and major banks holding year-end targets in the $5,400–$6,300 range.
The notable divergence in May was between the metal and the miners. Gold mining equities rose even as the gold price consolidated, recovering ground after lagging April’s metals rally and re-rating on a wave of strong first-quarter earnings. That dynamic worked in favor of the deep-dive precious metals positions, which had absorbed the brunt of the March correction.
Model Portfolio Performance
The challenge in May was the same one that defined March and April: a microcap value and momentum strategy lagging a market whose gains were concentrated in the largest, most expensive names. The rotation out of precious metals that began in late March is now largely complete. Materials settled at 9.7% of the portfolio from a peak above 16% in March, while industrials grew to 34.9%, absorbing the capital the ranking system redirected toward newly attractive names. The systematic process is functioning as designed, selling positions that have lost their edge and rotating into higher-ranked candidates, and the residual drag from unwinding a sector that drove returns through 2025 has now cleared.
Return results (as of May 31, 2026):
Total return (15 months): 65.5%
S&P 500 return (same period): 31.2%
Alpha generated: 34.3 percentage points
Annualized return: 49.7% (vs. 24.3% for S&P 500)
Monthly beats: 10 of 15 months (67%)
Quarterly beats: 5 of 5 completed quarters (100%)
Realized trades (since inception):
Win rate: 55% of 113 trades (62 winners, 51 losers)
Average return: 17.0% (winners: +46.7%, losers: -19.0%)
Average days held: 151.9 days
Realized multibaggers: 6
Risk-adjusted metrics (since inception):
Beta: 0.64
Sharpe Ratio: 2.15 (vs. 1.00 for S&P 500)
Sortino Ratio: 2.53 (vs. 1.46 for S&P 500)
Maximum Drawdown: -13.83% (vs. -16.19% for S&P 500)
May was an active month for realized trades, with several long-held positions exiting at strong gains. The largest realized trade of the month, an industrial holding entered roughly a year earlier, was closed at +98%, narrowly short of multibagger status, alongside a consumer staple realized at +71% and two further holdings closed in the +35% to +55% range. The count of realized multibaggers held at six. The portfolio currently carries four open multibaggers, two industrials and two technology stocks, with the largest single position, a technology name, sitting near the top of the ranking.
The risk profile remains the clearest expression of the strategy’s edge. A beta of 0.64 and a maximum drawdown of -13.83%, shallower than the S&P 500’s -16.19% over the same span, show the portfolio has delivered its returns with materially less risk than the index, even through the most difficult stretch since inception. The Sharpe Ratio of 2.15 remains well above the benchmark’s 1.00.
The current quarter is tracking behind the index, an honest consequence of three straight months of underperformance, and the since-inception alpha has compressed from its February peak. What has not changed is the longer-term record: ten monthly beats in fifteen, every completed quarter ahead of the benchmark, and a return better than double the S&P 500 since inception. Stretches like this one are an expected feature of a strategy that deliberately avoids the crowded, large-cap leadership currently driving the index.
Model Portfolio Holdings
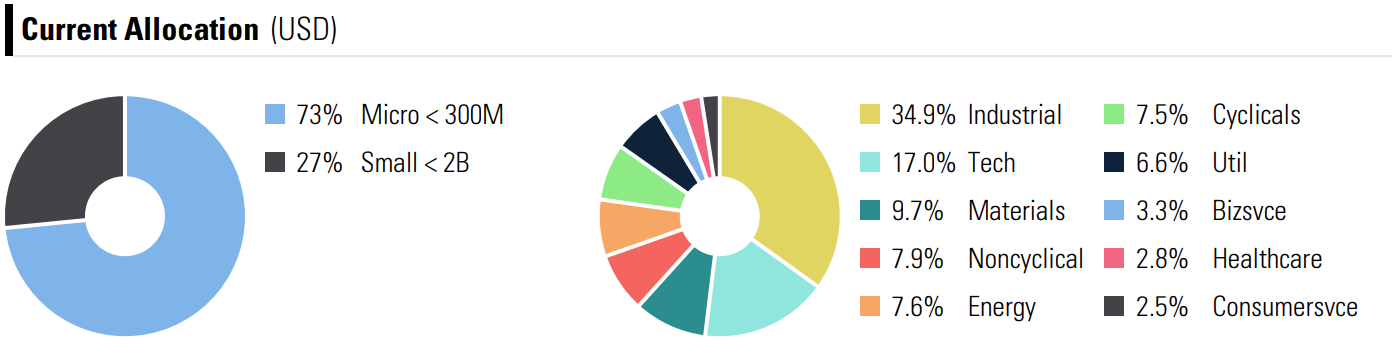
Current allocation is now spread broadly across sectors. Industrials lead at 34.9%, followed by Technology at 17.0%, Materials at 9.7%, Consumer Non-Cyclicals at 7.9%, Energy at 7.6%, and Consumer Cyclicals at 7.5%. Microcaps continue to dominate at 73% of the portfolio, with small caps making up the remaining 27%. Allocation charts and the full holdings breakdown appear in the attached performance report.
Deep-Dive Stock Performance
May was a recovery month for the deep-dive selection, with the precious metals positions leading the rebound and the healthcare names mixed after a heavy week of first-quarter earnings.
Deep-Dive Summary
Total positions: 8
Average return: +64%
Average holding period: ~9 months
Multibaggers: 3 of 8 (APM, MSA, SRB)
The three publicly available deep-dives, APM, MSA, and SRB, remain accessible to all subscribers in the deep-dives section.