

March was the worst month for the model portfolio since its launch thirteen months ago. The U.S.-Iran war, which escalated sharply after strikes began on February 28, sent shockwaves through global markets. The closure of the Strait of Hormuz disrupted roughly 20% of global oil supply, sending Brent crude above $100 for the first time since 2022 and triggering a cascade through equities, bonds, and precious metals alike. The S&P 500 posted its worst quarterly performance since 2022. Gold — counterintuitively — suffered its steepest monthly decline since October 2008, falling approximately 14% as the oil shock reignited inflation fears and eliminated expectations for Federal Reserve rate cuts.
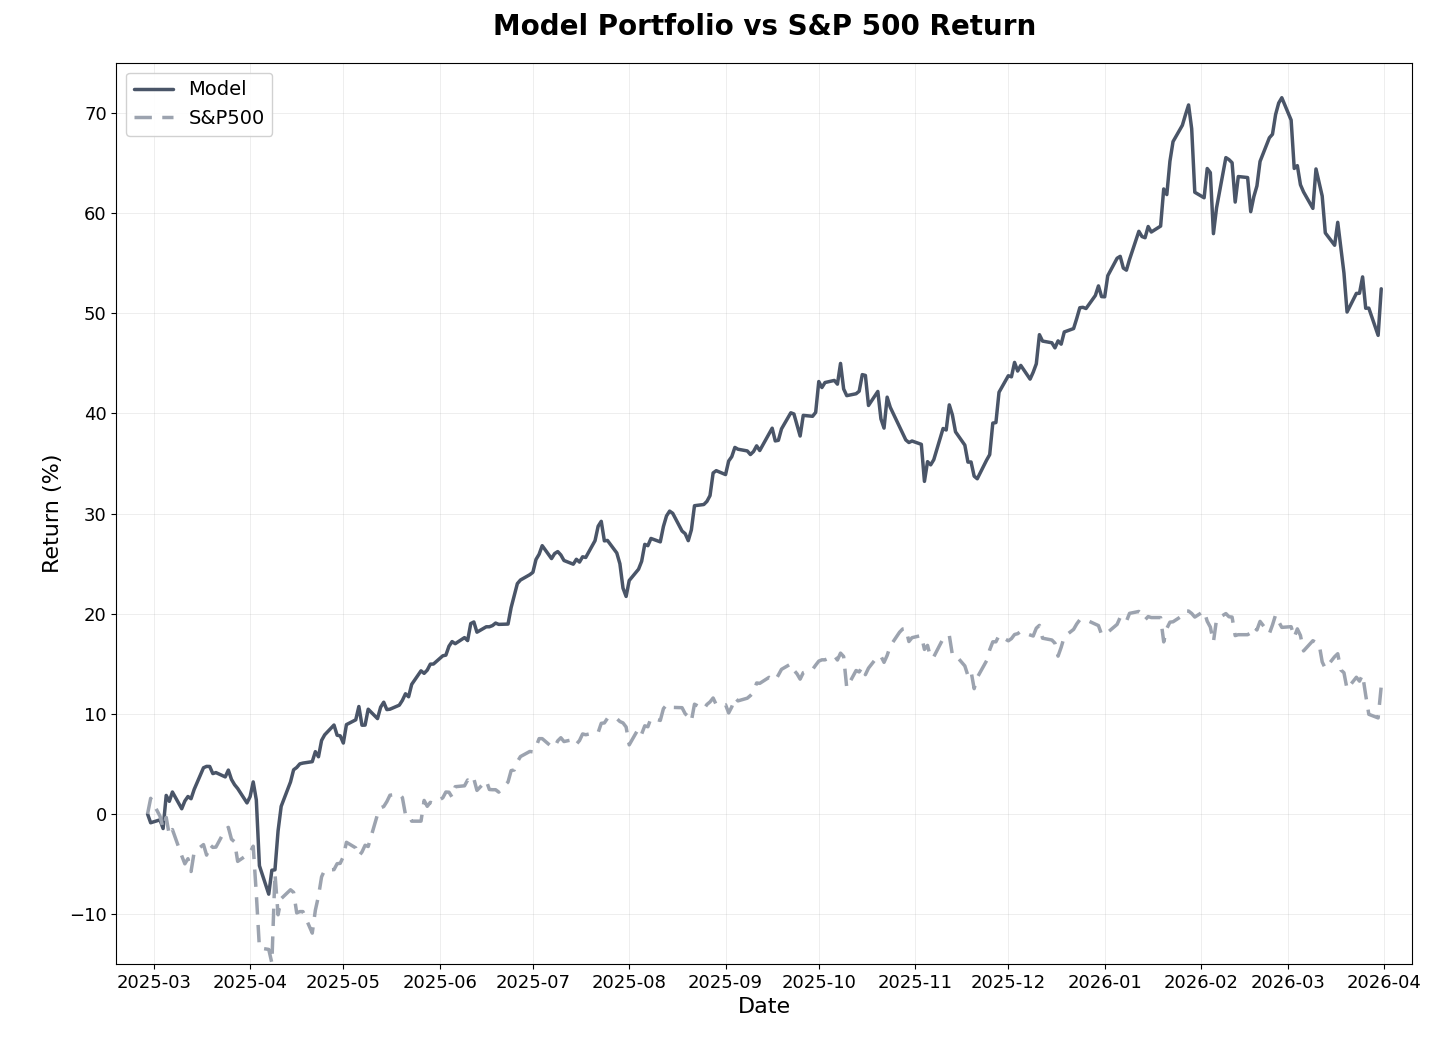
The model portfolio declined -11.1% in March, underperforming the S&P 500's -4.9% decline. Year-to-date, however, the portfolio is still up +0.5% versus -4.4% for the S&P 500. Since inception thirteen months ago, the portfolio has returned +52.4% versus +12.8% for the S&P 500, outperforming by 39.7 percentage points. Despite March's drawdown, the model has beaten the benchmark in all five quarterly periods since launch — including during both up and down markets.
My deep-dive stock selection was not spared. The average return across all eight positions fell from +108% last month to +55%, driven primarily by the precious metals correction. With an average holding period of just seven months, that still represents a return well above what the model portfolio has generated over the same timeframe. APM — the portfolio’s all-time best-performing deep-dive — has been extended for another twelve months following its annual review, with a new entry price and updated targets reflecting record FY2025 results.
Markets in March
The Iran war dominated markets in March, creating the kind of cross-asset volatility not seen since the onset of the Russia-Ukraine conflict in early 2022. The U.S.-Israeli strikes on Iran that began on February 28 triggered Iranian retaliation across the Gulf region, including attacks on vessels transiting the Strait of Hormuz. The effective closure of this critical chokepoint — through which roughly 20 million barrels of oil pass daily — transformed what might have been a contained military operation into a global energy supply shock.
Brent crude surged from roughly $70 per barrel to above $119 at its peak, with WTI settling around $100 by month-end. The immediate consequence was an inflation repricing: eurozone inflation jumped to 2.5% in March, driven by a 4.9% surge in energy costs. The Federal Reserve held rates steady at its March 18 meeting and penciled in just one rate cut for the remainder of the year — a sharp reversal from the two to three cuts markets had expected entering 2026. Bond yields climbed as investors repriced rate expectations, with the 10-year Treasury yield reaching 4.46% by March 27.
The precious metals sell-off was the most paradoxical development of the month. Gold, which entered 2026 near all-time highs above $5,500 after rallying 65% in 2025, fell approximately 14% in March — its worst monthly performance since the 2008 financial crisis. The mechanism is well understood but frequently misjudged by market participants: rising oil feeds directly into inflation expectations, which reduces the probability of rate cuts, which strengthens the dollar, which increases the opportunity cost of holding non-yielding assets like gold. In a market where speculative long positions had built up aggressively during 2025’s rally, this created a self-reinforcing liquidation cycle. Silver fared even worse, declining over 20% for the month. Gold and silver miners — heavily represented in the model portfolio and deep-dive selections — fell sharply alongside the metals. The junior gold miner index (GDXJ) saw significant outflows as leveraged positions unwound.
Energy stocks were the lone bright spot, with the S&P 500’s energy sector the only one to post positive returns for the month. The broader S&P 500 closed down -4.9% for March and -4.4% for Q1 2026, its worst quarterly showing since 2022. The Nasdaq entered correction territory, down more than 10% from its October peak.
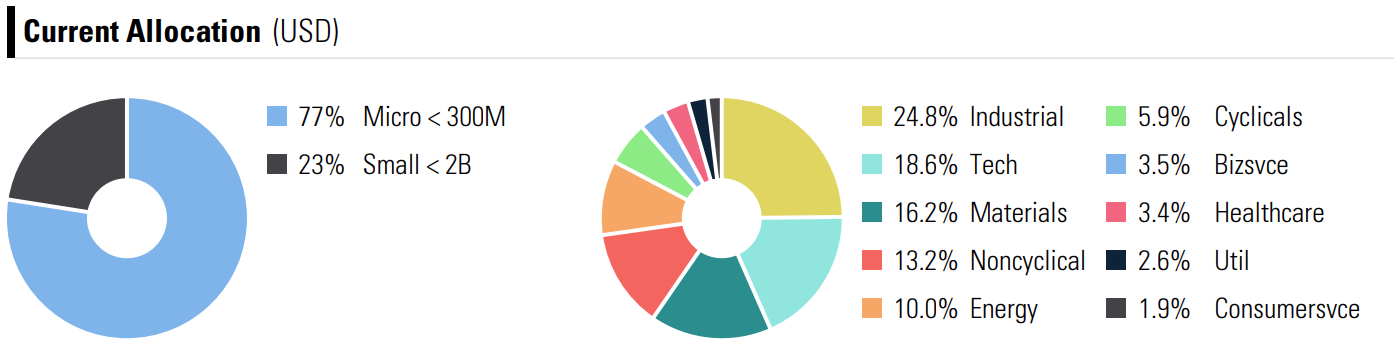
For the model portfolio, the heavy weighting in materials (16.2%) and the concentration in micro-cap stocks (77%) amplified the impact. Small-cap and micro-cap stocks, which had been outperforming since late 2025, gave back gains as risk appetite collapsed. European and international stocks — where the model holds significant exposure — faced additional headwinds as the energy crisis weighed more heavily on energy-dependent economies.
Model Portfolio Performance
March was the first month where the model significantly underperformed the benchmark, generating -11.1% versus -4.9% for the S&P 500 — an excess return of -6.2% for the month. The magnitude of the drawdown reflects the portfolio’s concentration in sectors and market caps that bore the brunt of the war-driven sell-off.
Return Results (as of Mar 31, 2026):
Total return (13 months): +52.4%
S&P 500 return (same period): +12.8%
Alpha generated: 39.7 percentage points
Annualized return: 47.4% (vs. 11.7% for S&P 500)
Monthly beats: 10 of 13 months (77%)
Quarterly beats: 5 of 5 quarters (100%)
Realized Trades (since inception):
Win rate: 55% of 98 trades (54 winners, 44 losers)
Average return: 15.1% (winners: +42.9%, losers: -19.1%)
Average days held: 141.5 days
Realized multibaggers: 5 (the latest being a precious metals miner realized on March 30 at +338% — the single largest realized trade in portfolio history)
Risk-Adjusted Metrics (since inception):
Beta: 0.21
Sharpe Ratio: 4.07 (vs. 1.12 for S&P 500)
Sortino Ratio: 5.13 (vs. 1.49 for S&P 500)
Maximum Drawdown: -13.8% (vs. -16.2% for S&P 500)
The maximum drawdown increased from -12.2% to -13.8% this month as the portfolio experienced its sharpest intra-month decline since inception. The drawdown remains below the S&P 500’s -16.2% worst peak-to-trough decline over the same period, and the Sharpe Ratio of 4.07 continues to indicate exceptional risk-adjusted performance despite a very difficult month.
The portfolio’s low beta of 0.21 is worth emphasizing in context. The model’s returns are driven overwhelmingly by stock-specific selection rather than broad market exposure. In months where broad market factors dominate — as in March, when macro forces drove correlations sharply higher across asset classes — a low-beta portfolio with concentrated sector exposures can temporarily underperform. The systematic approach does not attempt to time macroeconomic events; it captures alpha through persistent factor exposures that compound over time.
Current allocation remains concentrated in micro-caps (77%) and small caps (23%), with Industrials (24.8%), Technology (18.6%), and Materials (16.2%) as the largest sector exposures.
Deep-Dive Stock Performance
March brought the most challenging month for the deep-dive portfolio since its inception. The precious metals correction — gold’s worst month since 2008 and silver’s sharpest decline in over a decade — weighed heavily on the three mining positions that have driven the majority of deep-dive returns. APM completed its 12-month annual review and has been extended for another year with updated targets.
Deep-Dive Summary
Total positions: 8
Average return: +55%
Average holding period: ~7 months
Multibaggers: 2 of 8 (APM, MSA - both stocks reached their bull case target)
The three publicly available deep-dives (APM, MSA, and SRB) remain accessible to all subscribers — you can find them in the deep-dives section.