Market Overview
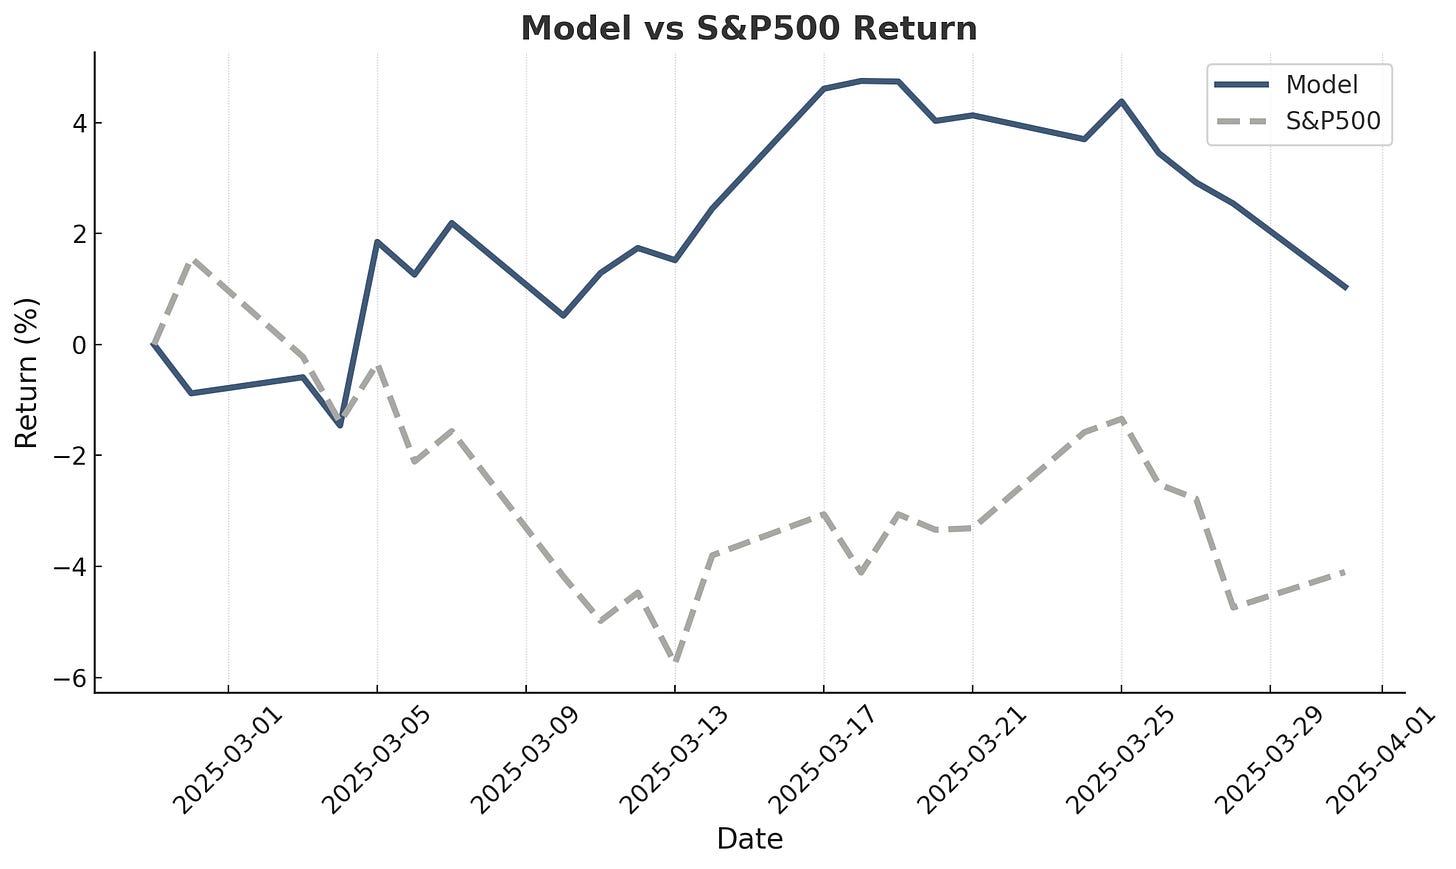
March brought significant market volatility as tariff uncertainty hit global markets. Following the cooling of the "Trump trade" that drove U.S. stocks lower and European stocks higher earlier this year, we've seen a market rotation impacting indices and model portfolios alike. Since last Monday, the model experienced a drop of approximately 4%, tracking closely with broader market movements in this headline-driven environment.
Performance Analysis
The Alpha Engineer model portfolio outperformed its benchmark in March by approximately 7.5%. Since the February 28th launch, we've maintained a performance edge of about 5% against the benchmark.
Looking at the top and bottom performers reveals a clear geographic trend. Among the top 5 performers, 4 are European stocks, while the bottom 5 performers include 4 North American stocks. This divergence reflects the current market dynamics.
It's worth noting that two bottom performers (SNAL and FORA:CAN) rank far below the model's sell threshold. However, they remain in the portfolio due to the 3-month (60 trading days) minimum holding period implemented in the model.
Holding Period Analysis
The decision to maintain stocks for at least 3 months in the model portfolio rather than selling immediately when they hit the rank limit involves a performance tradeoff. Backtests show the 3-month holding period reduces CAGR returns by approximately 0.5%, but this comes with a 5-10% decrease in portfolio turnover. For investors concerned with trading efficiency and costs, this tradeoff may be worthwhile.
Extended Performance Data
With only one month of official model portfolio results, I'm also sharing performance data from a 50-stock test portfolio launched on November 14th, 2024, upon completion of the Alpha Engineer model but prior to The Alpha Engineer Substack launch. Currently, this test portfolio shares 30 stocks (60%) with the official model portfolio. Results in March are similar as the model portfolio (approximately flat).
For comparison, I've included performance data for a version without the 3-month holding period. This pure rank-based sell approach has outperformed in the current dynamic environment, though the long-term difference is expected to be limited.
My personal portfolio, a 20-stock portfolio also launched on November 14th without a holding period constraint, has achieved returns similar to the test portfolio without the 3 month holding period. In USD terms, both have generated approximately 11% returns. The annualized excess return versus the S&P 500 stands at approximately 40%.
Deep-Dive Tracking
Going forward, I'll maintain performance tracking of deep-dive stocks in these monthly updates. This will include the initial price, current price, results after 1 year (interim update) and 2 years (closing price), my average expected return, and my bear, base, and bull case targets. After 1 year, I'll revisit each stock to evaluate whether it makes sense to hold for another year.
The Alpha Engineer --- Investing with a quantitative edge
Disclaimer: The Alpha Engineer shares insights from sources I believe are reliable, but I can't guarantee their accuracy---data's only as good as its inputs! This content (whether on Substack, via email newsletters, X, or elsewhere) is for informational and educational purposes only---it's not personalized investment advice. I'm not a registered investment advisor, just an engineer crunching numbers for alpha. My opinions are my own and may shift without notice. Investing involves risks, including the chance of losing money. Past performance, whether from back-testing or historical data, does not guarantee future results---outcomes can vary. So, please consult your financial advisor to see if any strategy fits your situation. Full disclosure: I may own positions in the securities I mention, as I actively manage my own portfolio based on these strategies.


