

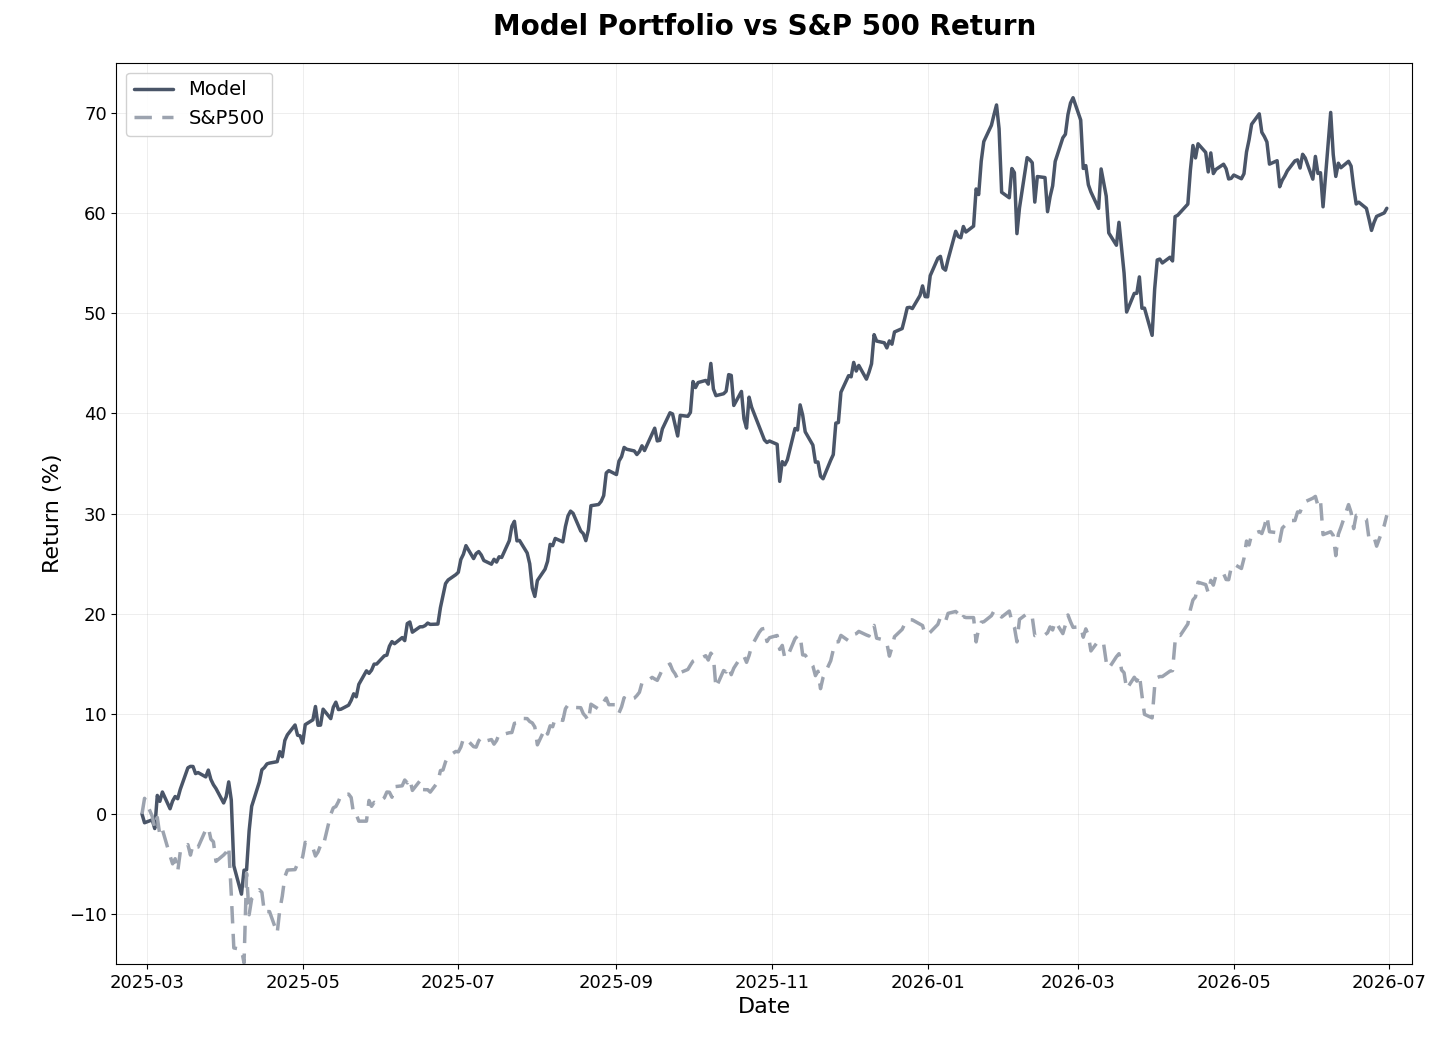
The model portfolio lost -3.0% in June against -1.0% for the S&P 500, a fourth consecutive month behind the benchmark. Since inception sixteen months ago, the model has returned +60.5% versus +29.8% for the S&P 500, an alpha of 30.7 percentage points, beating the index in 10 of 16 months. The second quarter closed as the first quarterly period behind the benchmark since inception: +5.3% for the model against +15.1% for an index that just delivered its strongest quarter in six years. Five of the six completed quarters remain ahead.
The first half of 2026 is now complete, with the model at +5.8% against +10.1% for the S&P 500, a deficit of 4.3 percentage points. The deep-dive selection gave back part of May’s recovery: the average return across the eight positions eased to +51% from +64%, as the precious metals miners followed a gold price that slid toward $4,000. The larger news arrived in the final days of the month, when one of the deep-dive positions signed a cash takeover agreement, covered in a separate update and in the position notes below.
Markets in June
June ended the two-month melt-up in U.S. equities. The S&P 500 slipped -1.0%, its first monthly decline since March, even as it closed its strongest quarter in six years. The composition of the market changed more than the headline suggests: investors started questioning the payoff on AI infrastructure spending, sending Microsoft to its worst month since 2000 and Oracle to its worst since 1990, while capital rotated into financials, healthcare, and industrials.
The Federal Reserve held rates at 3.50%–3.75% at Kevin Warsh’s first meeting as Chair, and the tone hardened. The statement was cut back sharply, the language pointing toward future easing was removed, and the updated projections showed a median year-end rate of 3.8%, up from 3.4% in March, with half the committee now expecting at least one hike this year. May inflation came in hot at 4.2%, driven largely by energy prices tied to the Middle East conflict, and markets moved from pricing cuts to pricing a possible hike by December.
Precious metals bore the brunt of that repricing. Gold fell from the mid-$4,500s at the end of May to just above $4,000 by late June, pressured by rising rate expectations and a U.S. dollar at a one-year high, while a mid-month U.S.–Iran framework agreement drained part of the safe-haven bid. Goldman Sachs cut its year-end target to $4,900 from $5,400, though targets across the street still sit between $4,900 and $6,000. The gold miners surrendered part of May’s re-rating, which weighed on both the model portfolio’s materials holdings and the deep-dive miners.
The most striking development for a small-cap investor happened elsewhere: the Russell 2000 set an all-time high in late June, closing its best first half since 1991 at +21% and leading the S&P 500 by the widest margin since 2003. That rally ran through U.S. financials and domestic cyclicals, sectors the model barely touches, while the global micro-cap universe where the model operates, dominated by European industrials and the miners, had a weaker month. The broadening of the market beyond mega-cap technology remains the most constructive signal for this strategy since inception, even if June’s particular mix left the portfolio on the wrong side of it.
Model Portfolio Performance
Key Performance Metrics:
Return results (as of June 30, 2026):
Total return (16 months): 60.5%
S&P 500 return (same period): 29.8%
Alpha generated: 30.7 percentage points
Annualized return: 42.4% (vs. 21.4% for S&P 500)
Monthly beats: 10 of 16 months (63%)
Quarterly beats: 5 of 6 completed quarters
Realized trades (since inception):
Win rate: 56% of 120 trades (67 winners, 53 losers)
Average return: 16.3% (winners: +44.2%, losers: -18.9%)
Average days held: 151.6 days
Realized multibaggers: 6
Risk-adjusted metrics (since inception):
Beta: 0.62
Sharpe Ratio: 1.82 (vs. 1.10 for S&P 500)
Sortino Ratio: 2.22 (vs. 1.59 for S&P 500)
Maximum Drawdown: -13.83% (vs. -16.19% for S&P 500)
June was a busy month for exits, with ten positions closed at mixed results. The best trades were a technology holding realized at +24.9% and a consumer cyclical at +21.4%; the weakest was an energy-services position closed at -27.4%. The realized trade count reached 120 since inception, with the win rate steady at 56% and the count of realized multibaggers holding at six.
The portfolio’s largest position, a technology name at 4.4% of assets, crossed the +200% mark in June, a triple from entry. It leads three open multibaggers, alongside an industrial at +134% and a second technology holding at +133%. A fourth position finished the month at +99.9%, a rounding error below the line after June’s decline.
The risk profile remains intact even as the return gap widened. Beta sits at 0.62 and the maximum drawdown at -13.83%, still shallower than the S&P 500’s -16.19%, while the Sharpe Ratio of 1.82 stays well above the benchmark’s 1.10 despite compressing from earlier peaks. Over the trailing twelve months the model returned +29.4% versus +22.1% for the index, so even through the worst relative stretch since inception, the one-year number remains ahead.
The second quarter deserves a plain statement: the model gained +5.3% while the S&P 500 gained +15.1%, and the perfect quarterly record ended at five. A global micro-cap value and momentum strategy will trail when returns concentrate in the largest, most expensive names, and for four straight months it did. The systematic process keeps doing its job regardless, selling positions that lost their edge and rotating into higher-ranked candidates, and the since-inception return of +60.5% remains roughly double the index.
Model Portfolio Holdings
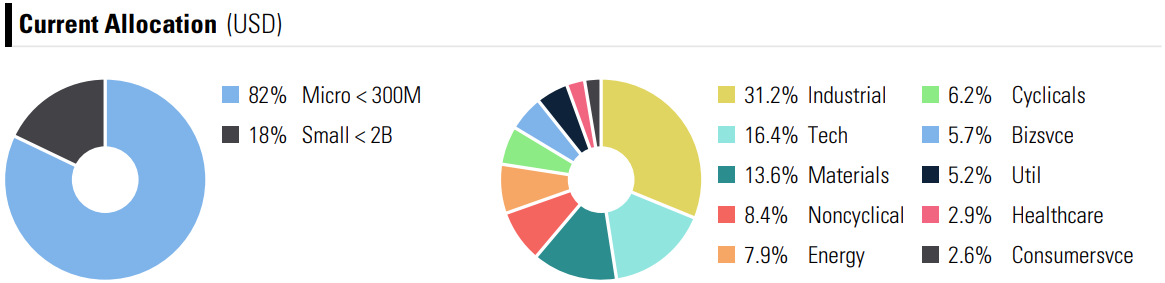
Current allocation shifted further toward the smallest names. Industrials lead at 31.2%, followed by Technology at 16.4% and Materials at 13.6%, the latter up from 9.7% as the ranking redirected capital back into the sector after its pullback. Consumer Non-Cyclicals stand at 8.4%, Energy at 7.9%, and Consumer Cyclicals at 6.2%. Microcaps now make up 82% of the portfolio, up from 73% last month, with small caps at the remaining 18%. Allocation charts and the full holdings breakdown appear in the attached performance report.
Deep-Dive Stock Performance
June’s deep-dive story had two threads: a cash takeover agreement for one of the positions, signed in the final days of the month, and a precious metals pullback that trimmed the group’s average return.
Deep-Dive Summary
Total positions: 8
Average return: +51%
Average holding period: ~10 months
Multibaggers: 2 of 8 (APM, MSA)
SRB slipped just below the multibagger threshold at +96% after a sharp June pullback in the miners. The three publicly available deep-dives, APM, MSA, and SRB, remain accessible to all subscribers in the deep-dives section.