

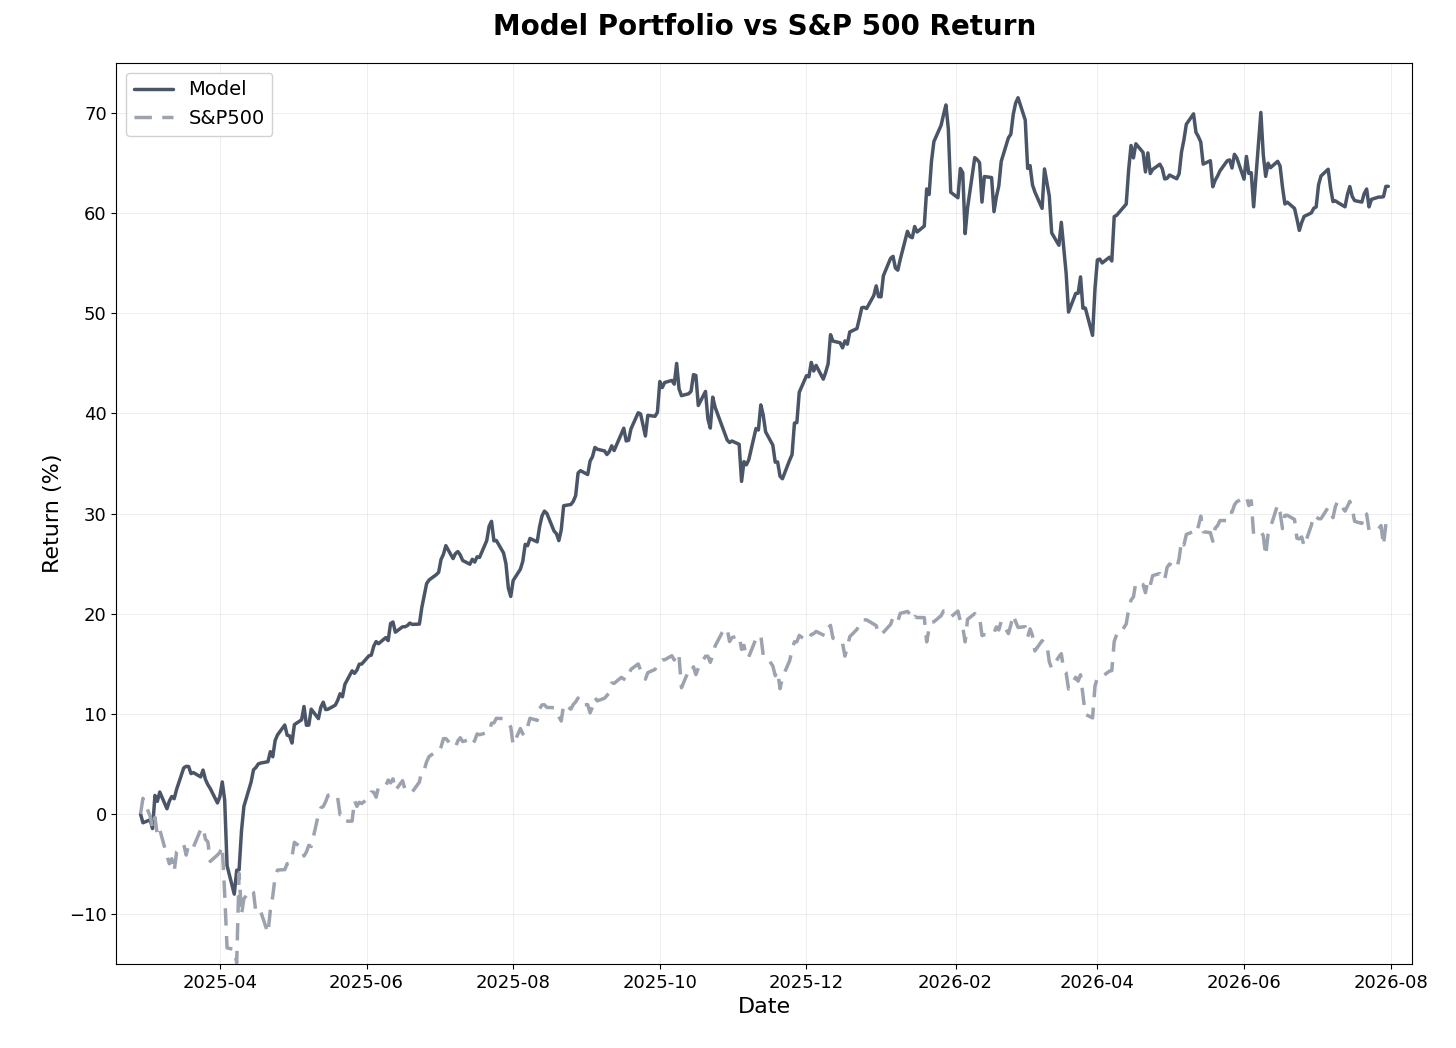
The model portfolio gained +1.4% in July while the S&P 500 finished the month flat, ending a run of four consecutive months behind the benchmark. Since inception seventeen months ago, the model has returned +62.7% versus +29.9% for the S&P 500, an alpha of 32.8 percentage points, beating the index in 11 of 17 months. The year-to-date gap narrowed to 2.8 percentage points from 4.3 at the half, with the model at +7.3% against +10.1% for the index. The third quarter opens with the model ahead.
The deep-dive selection came through a news-heavy month broadly steady: the average return across the eight positions stands at +49%, compared with +51% at the end of June. MSA was the standout with a double-digit rally, while SRB declined for a second consecutive month. Five of the eight positions delivered scheduled quarterly reports or investor updates during July; the position notes below cover each.
Markets in July
The S&P 500 closed July within a whisker of where it started, and the flat headline hid a volatile month. The questions about the payoff on AI infrastructure spending that surfaced in June kept driving rotation beneath the surface, and the final week of earnings whipped the megacaps in both directions. Under that churn, the month split cleanly into a two-week relief rally and a hawkish comedown.
The relief came from inflation. June CPI, released July 14, fell -0.4% on the month, the largest monthly decline since April 2020, as gasoline prices tumbled following the U.S.–Iran ceasefire. The annual rate eased to 3.5% from 4.2% in May, core inflation came in at 2.6%, and both landed well below forecasts. Yields dropped on the release and equities rallied.
The comedown came from a refueled Iran war and the Federal Reserve. At the July 28–29 meeting, Kevin Warsh’s second as Chair, the committee held rates at 3.50%–3.75% on a 9–3 vote, with three regional presidents dissenting in favor of a hike. Markets ended the month pricing roughly 65% odds of an increase in September, long-term yields climbed with the 30-year Treasury above 5.1%, and stocks sold off into the final days before a partial recovery on the last session.
Gold found a floor. After June’s slide toward $4,000, the metal added +0.5% in July, its first monthly gain since February, closing just above $4,000. The soft CPI print and the Fed’s hold supported the price, September-hike odds capped the recovery, and central bank demand continued, with the People’s Bank of China buying gold for a twentieth consecutive month. For the model’s materials holdings and the deep-dive miners, the sector-wide pressure of June eased even as individual names diverged.
The Russell 2000 cooled after its record first half, drifting back from the 3,000 mark it touched at the end of June to close July around 2,931. The character of this year’s U.S. small-cap rally remains an awkward fit for a value and quality discipline: unprofitable Russell 2000 companies have returned roughly +154% since mid-2025 against +34% for their profitable peers, as the market pays for AI exposure ahead of earnings. The model’s global micro-cap universe sits largely outside that trade, and in July the systematic approach beat both the S&P 500 and the U.S. small-cap index.
Model Portfolio Performance
Key Performance Metrics:
Return results (as of July 31, 2026):
Total return (17 months): 62.7%
S&P 500 return (same period): 29.9%
Alpha generated: 32.8 percentage points
Annualized return: 40.8% (vs. 20.2% for S&P 500)
Monthly beats: 11 of 17 months (65%)
Quarterly beats: 5 of 6 completed quarters
Realized trades (since inception):
Win rate: 56% of 125 trades (70 winners, 55 losers)
Average return: 15.7% (winners: +42.7%, losers: -18.6%)
Average days held: 155.9 days
Realized multibaggers: 6
Risk-adjusted metrics (since inception):
Beta: 0.62
Sharpe Ratio: 1.82 (vs. 1.10 for S&P 500)
Sortino Ratio: 2.22 (vs. 1.59 for S&P 500)
Maximum Drawdown: -13.83% (vs. -16.19% for S&P 500)
July was quieter on the exit side after June’s ten closures, with five positions leaving the portfolio. The best was a business-services holding realized at +18.8% after 133 days, and two long-held UK positions were closed at +6.3% and +6.1%. The two losing exits were consumer non-cyclical names at -10.5% and -11.4%. The realized count now stands at 125 trades, with the win rate at 56% and the number of realized multibaggers steady at six.
The open book strengthened where it counts: the count of open multibaggers rose from three to five. An industrial position moved to the top of the open book at +160%, and two holdings crossed the line during the month, an industrial at +103% and the position that ended June at +99.9%, now at +101%. The technology holding that crossed the +200% mark in June gave back part of that advance and stands at +133%, still the portfolio’s largest position at 3.4% of assets, with a second technology name at +122% completing the group.
Over the trailing twelve months the model returned +33.6% versus +19.5% for the index, and the annualized since-inception return of 40.8% remains roughly double the benchmark’s 20.2%. Beta of 0.62 and a maximum drawdown of -13.83%, still shallower than the S&P 500’s -16.19%, show the risk profile intact through the difficult stretch. A single month proves little, but July restored the pattern the strategy is built on: holding its ground when the index stalls and compounding through a universe the benchmark barely touches.
Model Portfolio Holdings
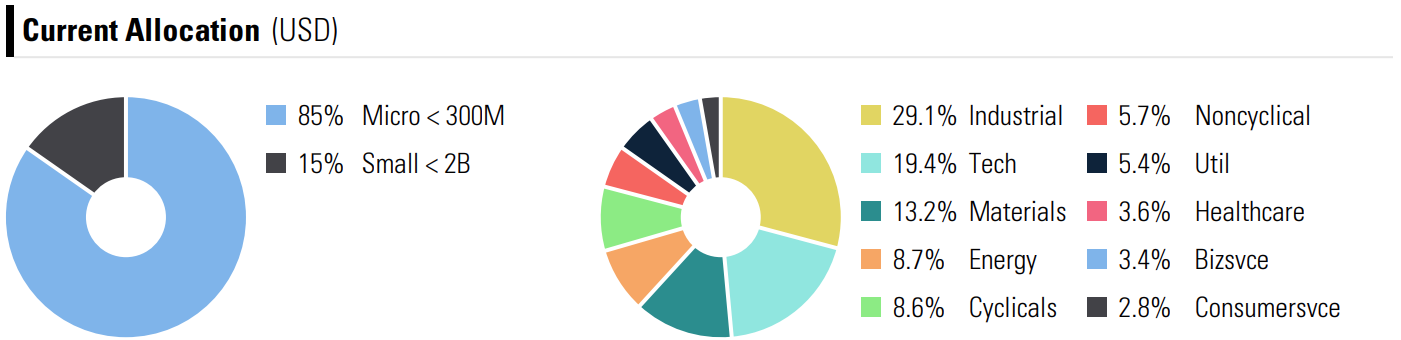
Current allocation stayed close to June’s shape. Industrials lead at 29.1%, followed by Technology at 19.4% and Materials at 13.2%. Energy stands at 8.7%, Consumer Cyclicals at 8.6%, and Consumer Non-Cyclicals at 5.7%. Microcaps now make up 85% of the portfolio, up from 82% last month, with small caps at the remaining 15%. Allocation charts and the full holdings breakdown appear in the attached performance report.
Deep-Dive Stock Performance
July was a scheduled-news month across the deep-dive list. Two of the miners published quarterly production reports, the media position reported its first full quarter at its new scale, the newest healthcare holding delivered second-quarter results alongside a dividend increase, and another hosted its investor day. Prices diverged: MSA rallied 11%, while SRB posted a second consecutive double-digit decline.
Deep-Dive Summary
Total positions: 8
Average return: +49%
Average holding period: ~11 months
Multibaggers: 2 of 8 (APM, MSA)
The three publicly available deep-dives, APM, MSA, and SRB, remain accessible to all subscribers in the deep-dives section.