

The model portfolio delivered +6.9% in January while the S&P 500 gained just +1.5%, extending our streak to 9 of 11 months beating the benchmark. Since inception on February 27th, the portfolio has now returned +62.1% versus +19.7% for the S&P 500—outperforming by 42.4 percentage points in just eleven months. On an annualized basis, the model is returning 68.7% versus 21.5% for the benchmark.
The deep-dive stocks continue their remarkable run. The average return across all seven positions now stands at +118%, with the original four positions averaging +203%. Three of those four are multibaggers. January brought two significant updates: MSA (Mineros SA) reached its bull case target on January 26th, and the Thunderbird Entertainment acquisition by Blue Ant Media closed on January 28th.
Markets in January
January capped a strong start to 2026 for U.S. equities, with the S&P 500 posting a modest +1.4% gain for the month—triggering the historically bullish “January Barometer.” The index reached new all-time highs early in the month before volatility returned in the final days.
Small caps staged a breakout in January. The Russell 2000 hit fresh all-time highs and significantly outperformed large caps, with the index gaining approximately 5.3% for the month—far exceeding the S&P 500’s advance. This “Great Rotation” saw investors shift capital from mega-cap technology stocks toward domestically focused smaller companies. The valuation gap between small and large caps had reached a 25-year extreme by late 2025, creating a “coiled spring” effect as lower interest rates and favorable domestic policies attracted capital to the small-cap universe. The Federal Reserve held rates steady at the 3.50%-3.75% range following three consecutive cuts in late 2025.
Precious metals experienced extreme volatility in January. Gold and silver went parabolic in the final week of the month, with gold spiking above $5,500 per ounce on January 29th before a sharp correction brought prices back to around $5,000-$5,100 by month-end. This volatility had a pronounced impact on the model portfolio. The systematic ranking currently holds approximately 24% in precious metals miners—not by design, but because these stocks scored exceptionally well on the model’s value and momentum factors. On January 28th, the portfolio reached a peak of +70.8% since inception before the metals correction pulled returns back to +62.1% by January 30th—a dramatic 8.7 percentage point swing in just two trading days.
This illustrates both the power and the risk of a systematic approach. The model identified precious metal miners such as GG and APM well before their major runs—simply because they ranked highly on fundamental and momentum metrics. The concentration is an outcome of the ranking system, not a deliberate sector bet. When the model’s factors align with a sector experiencing strong tailwinds, as precious metals have with gold’s +65% gain since early 2025, the results can be exceptional. But the same concentration creates volatility when that sector corrects. The model will continue to hold these positions as long as they remain in the top 10% of the ranking—and will systematically exit when they no longer qualify.
Model Portfolio Performance
January marked another strong month for the model, generating +6.87% versus just +1.47% for the S&P 500—an excess return of +5.40% for the month.
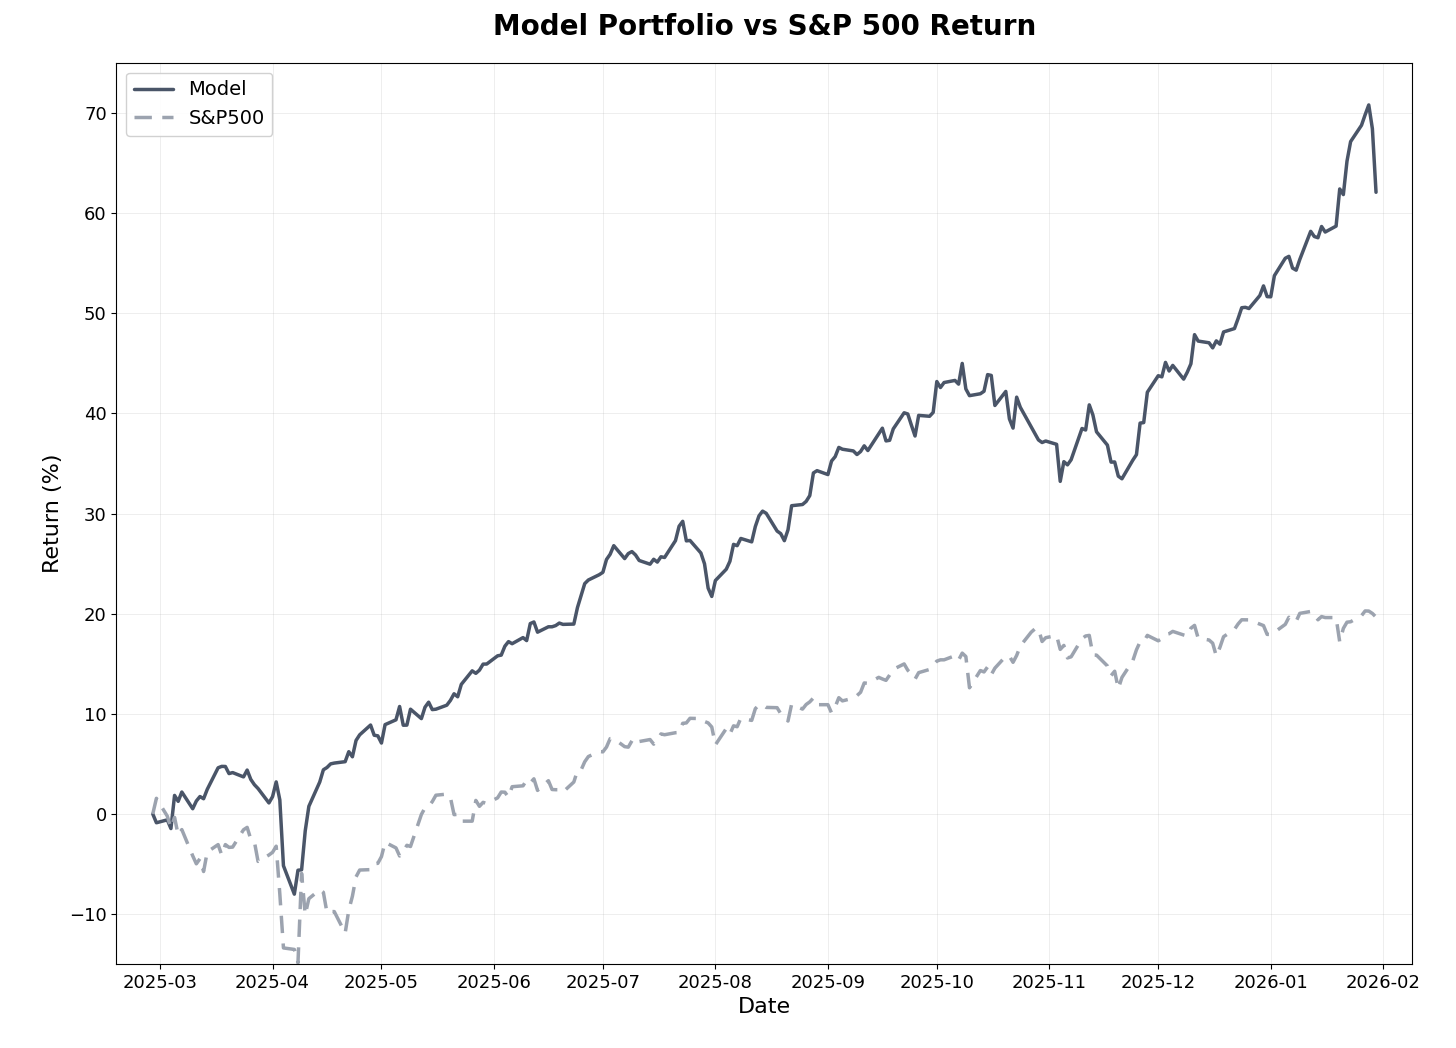
Return Results (as of Jan 30, 2026):
Total return (11 months): 62.1%
S&P 500 return (same period): 19.7%
Alpha generated: 42.4%
Annualized return: 68.7%
Monthly beats: 9 of 11 months (82%)
Realized Trades (since inception):
Win rate: 52% of 75 trades
Average return: 10.3%
Average days held: 113.5 days
Portfolio turnover: 124% (135% annualized)
Risk-Adjusted Metrics (since inception):
Beta: 0.25
Sharpe Ratio: 3.48 (vs. 1.25 for S&P 500)
Sortino Ratio: 4.55 (vs. 1.61 for S&P 500)
Maximum Drawdown: -12.2% (vs. -16.2% for S&P 500)
The Sharpe Ratio of 3.48 remains exceptional, indicating strong risk-adjusted performance well above the benchmark. The portfolio’s low beta of 0.25 demonstrates the model’s focus on idiosyncratic value opportunities rather than broad market exposure.
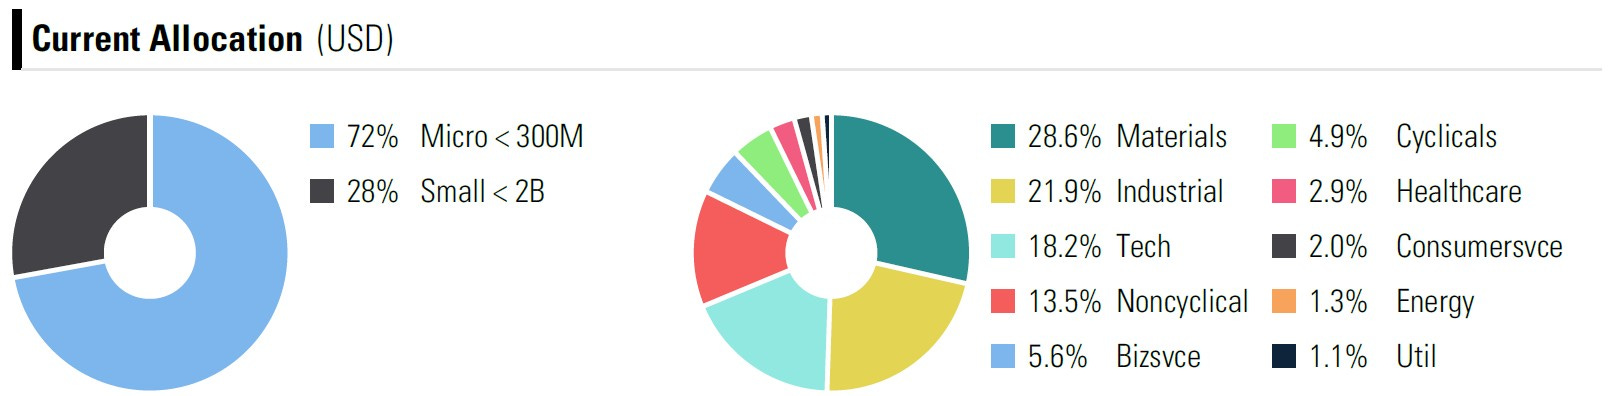
As of January 30th, the portfolio’s two largest positions remain precious metals miners: GG (Golconda Gold) at 7.8% and APM (Andean Precious Metals) at 7.7%. The portfolio holds four multibaggers—three precious metals miners and a Swedish industrial stock—with a fifth position (Polish industrial) sitting at +99.5%, just below the multibagger threshold.
Current allocation remains concentrated in microcaps (72%) and small caps (28%), with Materials (28.6%) and Industrials (21.9%) as the largest sector exposures.
Deep-Dive Stock Performance
January brought two significant developments for the deep-dive positions, alongside continued strong performance from the precious metals miners.
Deep-Dive Summary
Average return across all 7 positions: +118%
Original 4 positions (pre-November): +203% average
Multibaggers: 3 of 7 (APM, MSA, SRB)
The three multibagger deep-dives (APM, MSA, and SRB) are available to all subscribers—you can find them in the deep-dives section.