

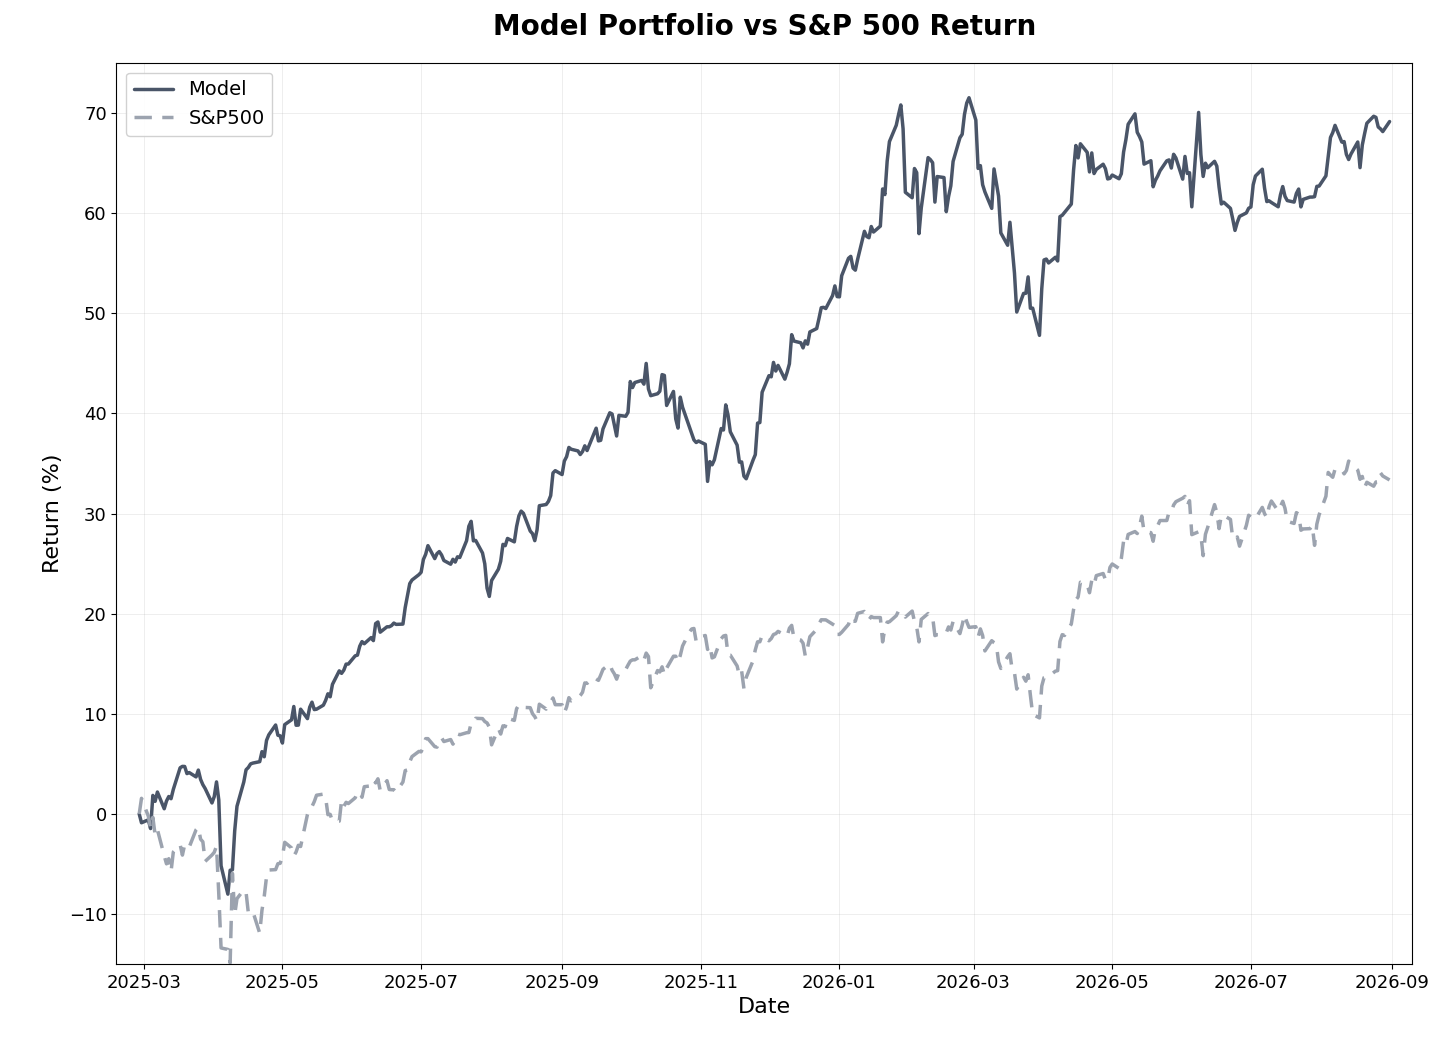
The model portfolio gained +4.0% in August against +2.7% for the S&P 500, a second consecutive month ahead of the benchmark. Since inception eighteen months ago, the model has returned +69.1% versus +33.4% for the S&P 500, an alpha of 35.8 percentage points, beating the index in 12 of 18 months. The year-to-date gap narrowed to 1.6 percentage points from 2.8 at the end of July, with the model at +11.5% against +13.1% for the index. Two months into the third quarter, the model leads +5.4% to +2.7%.
The deep-dive list had a strong month. Six positions gained double digits, SRB moved back above the multibagger line, and the average return across the ten coverage positions stands at +60%, up from +49% at the end of July.
Markets in August
The S&P 500 gained +2.7% in August and ended a two-month losing streak, though the path was uneven. The index set a closing record of 7,799 in mid-August after July CPI came in at +0.1% on the month and 3.4% on the year, with oil easing at the same time, then gave part of it back as Treasury yields climbed into the final week. Technology led again: the Nasdaq added +3.9%, and second-quarter earnings growth for the S&P 500 reached 52% with almost all companies reported, the highest rate since the second quarter of 2021. Beneath the earnings strength the economy cooled: July payrolls fell by 23,000, the first monthly decline in more than two years, and second-quarter GDP growth slowed to an annualized 1.5%.
The Fed did not meet in August, so Kevin Warsh’s Jackson Hole speech on August 28 carried the month’s policy signal. His message was hawkish: the summer’s inflation readings were better than expected, but in his reading the underlying trend had not meaningfully improved, and the committee’s focus belongs on prices. Futures moved from roughly one-in-three odds of a September hike before the speech to roughly 60% after it, the 10-year yield ended the month at 4.75%, and small caps sold off in the last week while the S&P 500 held on to a weekly gain. Oil stayed in the mid-$80s to low $90s on reduced shipments through the Strait of Hormuz, keeping U.S. gasoline above $4 a gallon.
Gold had its rebound month. The metal gained +9.6% to close near $4,500, running to a fifth consecutive weekly gain by late August and recovering a good part of the second-quarter slide that followed January’s record near $5,600. The soft July CPI and the Middle East backdrop supported the early part of the move; the Treasury supplied the late part. On August 19, with the 30-year yield at a 19-year high, Scott Bessent surprised the market by at least doubling buybacks of 10- to 30-year debt, and although yields erased the drop within a day, the signal that the Treasury will lean on the long end when yields run weakened the dollar and sent gold to a three-month high the same week. Warsh’s speech took some of it back in the final session, but for the deep-dive miners and the model’s materials holdings the month reversed the sector-wide pressure of June and July.
The Russell 2000 added +0.9% to close at 2,956, still short of the 3,000 mark it touched at the end of June and behind the S&P 500 for the month, and European indexes barely moved, with the STOXX Europe 600 at +0.2% and the FTSE at -0.4%. Roughly four-fifths of the model portfolio sits outside the U.S., so the +4.0% month came from the holdings rather than from a rising index. In August the systematic approach beat the S&P 500, the U.S. small-cap index, and the European benchmarks its universe draws on.
Model Portfolio Performance
Key Performance Metrics:
Return results (as of August 31, 2026):
Total return (18 months): 69.1%
S&P 500 return (same period): 33.4%
Alpha generated: 35.8 percentage points
Annualized return: 41.4% (vs. 21.4% for S&P 500)
Monthly beats: 12 of 18 months (67%)
Quarterly beats: 5 of 6 completed quarters
Realized trades (since inception):
Win rate: 55% of 138 trades (76 winners, 62 losers)
Average return: 14.2% (winners: +40.8%, losers: -18.4%)
Average days held: 154.6 days
Realized multibaggers: 6
Risk-adjusted metrics (since inception):
Beta: 0.63
Sharpe Ratio: 1.80 (vs. 1.04 for S&P 500)
Sortino Ratio: 2.22 (vs. 1.54 for S&P 500)
Maximum Drawdown: -13.83% (vs. -16.19% for S&P 500)
August was the busiest exit month since March, with thirteen positions leaving the portfolio, and the exits netted out close to flat. The best was an aerospace and defense manufacturer realized at +68.9% after 181 days, followed by a consumer non-cyclical services holding at +21.4% after 147 days. On the other side, a Canadian metal ore miner was closed at -55.9% after 148 days and a German technology consulting position at -24.0% after 91 days. Six of the thirteen exits were winners, which took the win rate from 56% to 55% and the average realized return from 15.7% to 14.2%, with the count of realized multibaggers steady at six.
The open book holds three multibaggers at month-end, down from five at the end of July. The technology holding that leads the book stands at +149% and remains the largest position at 3.5% of assets, with two industrials at +127% and +122% completing the group. A consumer services holding at +92% and a second technology name at +70% sit next in line.
Over the trailing twelve months the model returned +26.0% versus +20.2% for the index, down from +33.6% last month because August 2025, a +10.3% month, rolled out of the window. The annualized since-inception return of 41.4% against 21.4% for the S&P 500, a beta of 0.63, and a maximum drawdown of -13.83% versus -16.19% changed little from July. Portfolio equity closed the month within 1.4% of the February high. Two months ahead of the benchmark settle nothing, but they are the right two months to follow a weak second quarter.
Model Portfolio Holdings
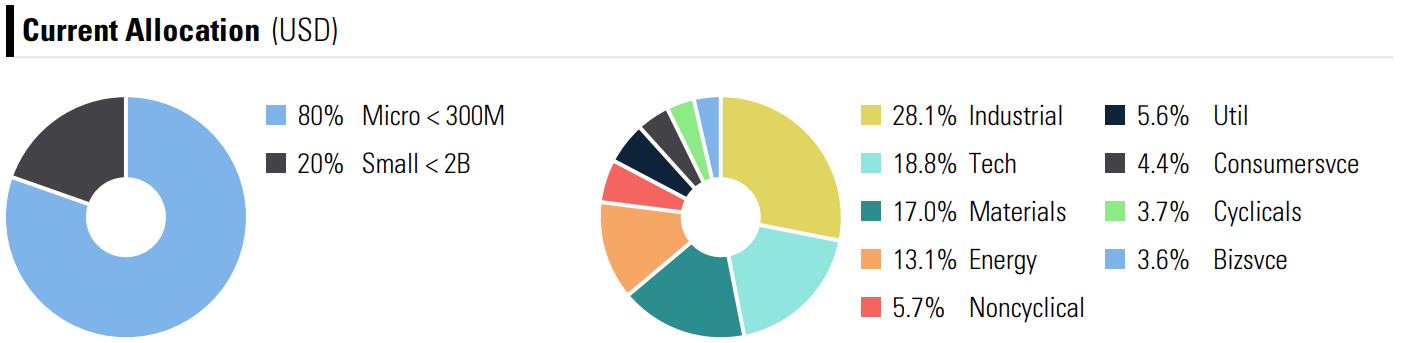
The weekly rebalancing shifted the allocation toward resources. Industrials still lead at 28.1%, followed by Technology at 18.8%, while Materials rose to 17.0% from 13.2% and Energy to 13.1% from 8.7%. Consumer Cyclicals fell to 3.7% from 8.6%, with Consumer Non-Cyclicals at 5.7% and Utilities at 5.6%. Microcaps make up 80% of the portfolio, down from 85% last month, with small caps at the remaining 20%. Allocation charts and the full holdings breakdown appear in the attached performance report.
Deep-Dive Stock Performance
August was the heaviest reporting month of the year for the deep-dive list. Five positions published second-quarter results, the pending takeover moved to a scheduled shareholder vote, the media position enlarged its buyback, and the newest holding booked another order. Prices moved with gold and the earnings calendar: SRB rallied 28%, the water-technology holding gained 26% on its results, and the pharmacy-services position fell 13% on no company news.
Deep-Dive Summary
Total positions: 10 (APM’s original and extended coverage counted separately)
Average return: +60%
Average holding period: ~10 months
Multibaggers: 3 of 10 (APM, MSA, SRB)
The tenth position was added in June and appears in the monthly review for the first time below.