

April delivered a strong recovery from March’s drawdown, though not enough to fully retrace the loss. A fragile U.S.-Iran ceasefire held through most of the month, and despite oil prices remaining elevated, equities rallied hard on the back of strong Q1 earnings and surging AI infrastructure spending. The S&P 500 rallied +10.5%, its strongest monthly performance since 2020, while gold partially retraced its March decline as the speculative liquidation in precious metals eased.
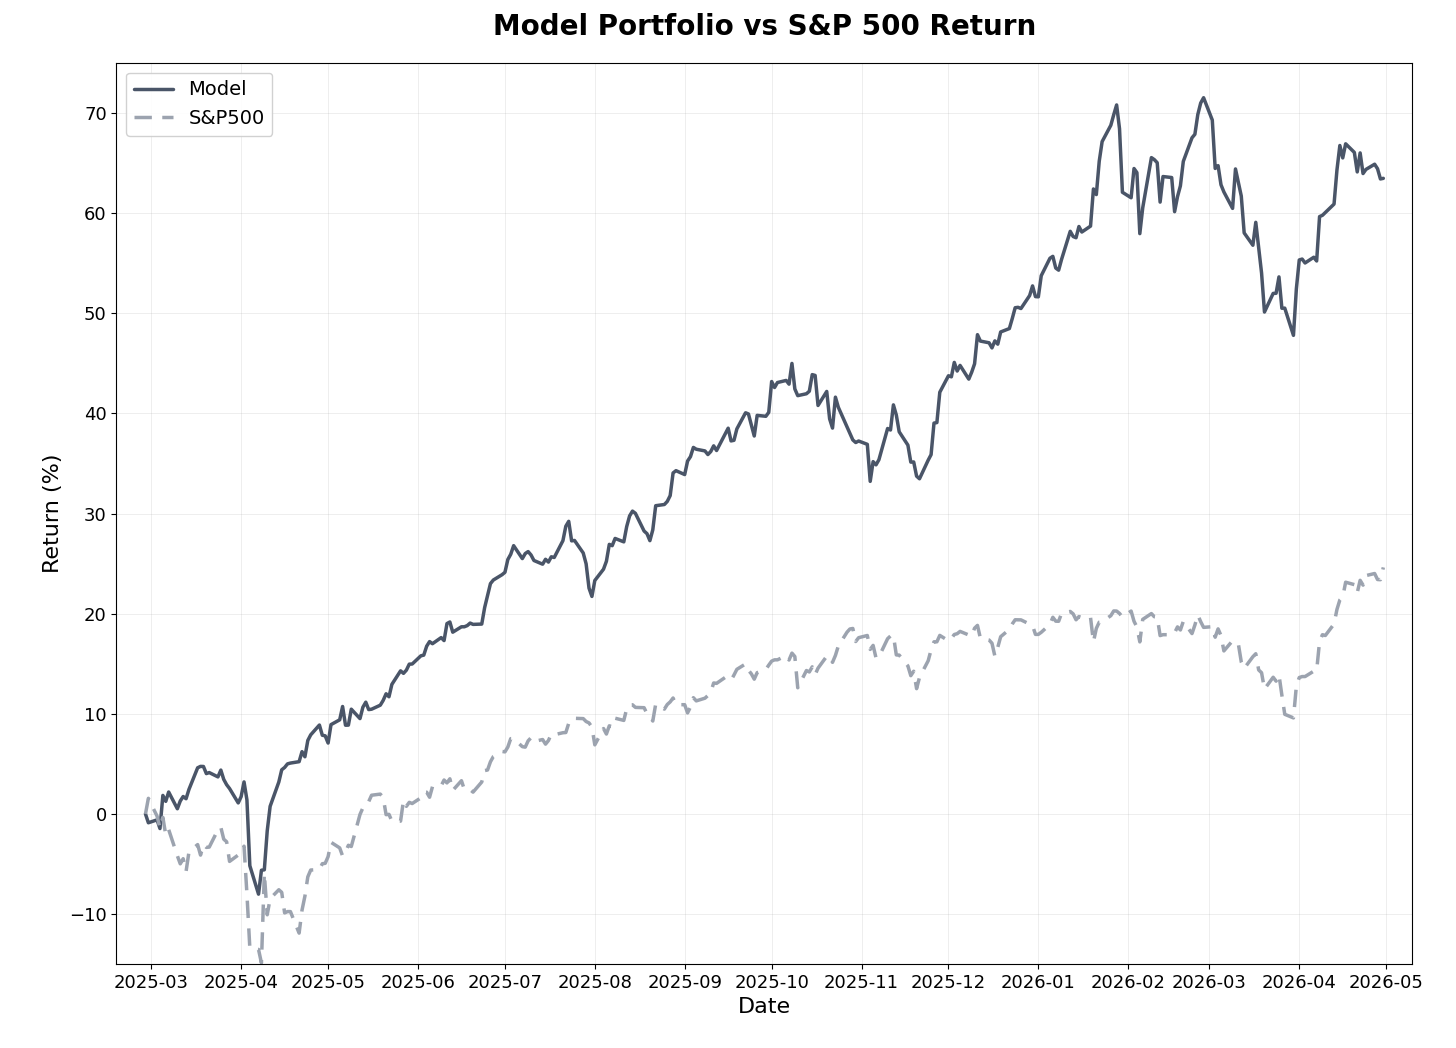
The model portfolio gained +7.2% in April, a strong month in absolute terms but trailing the S&P 500’s narrow, semiconductor-led rebound by 3.3 percentage points. The combined effect of March’s drawdown and April’s partial recovery means the portfolio is -4.7% since the start of March versus +5.1% for the S&P 500 over the same span — a two-month gap of nearly 10 percentage points. Year-to-date, however, the portfolio remains ahead at +7.8% versus +5.7% for the S&P 500. Since inception fourteen months ago, the model has returned +63.5% versus +24.6% for the S&P 500, an alpha of 38.9 percentage points, beating the benchmark in 10 of 14 months and in all five completed quarterly periods.
The deep-dive selection held its ground during the recovery. The average return across all eight active positions stands at +55% with an average holding period of approximately eight months. Serabi Gold joined APM and Mineros as a third multibagger, recovering strongly from March’s correction. The model portfolio’s third realized multibagger gold trade came in late April when a precious metals position was sold at +209%, the second-largest realized trade in portfolio history.
Markets in April
April produced a paradoxical setup. The U.S.-Iran conflict moved into a fragile ceasefire that held through most of the month, but the Strait of Hormuz remained essentially closed and oil prices stayed elevated throughout. Brent crude averaged roughly $102 per barrel, peaking near $126 mid-month and ending April around $114. The Federal Reserve held rates steady, with markets continuing to price in only one cut for the remainder of 2026 given the persistent inflation overhang from energy.
Despite this backdrop, U.S. equities staged their strongest monthly advance since 2020. The S&P 500 climbed 10.5% to a record close of 7,165 on April 24, but the rally’s leadership was unusually narrow. The story was overwhelmingly about semiconductors and AI infrastructure: Intel surged approximately 50% in April — its biggest monthly gain since 1974 — and the iShares Semiconductor ETF gained more than 30% from late March. Q1 earnings provided fundamental cover, with 88% of S&P 500 reporters beating expectations at the highest rate since 2021. Outside semiconductors and AI-adjacent names, breadth was decidedly thinner.
Precious metals partially recovered. Gold climbed from approximately $4,200 at the end of March to around $4,800 by April 30, retracing roughly half of March’s decline as speculative liquidation eased. Silver also recovered, though gold mining equities followed the metals higher only modestly as capital rotated aggressively into AI infrastructure names. The structural bull case for precious metals remains intact, with major banks maintaining year-end gold targets in the $5,400–$6,300 range.
The model portfolio’s challenge in April was less about lagging the rebound than about not fully recovering March’s drawdown. The materials weighting from the precious metals run dropped from 16.2% at end of March to 9.5% by month-end as a gold miner was sold. Industrials grew from 24.8% to 30.5% to absorb the rotation. The systematic ranking is doing exactly what it should — selling stocks that have lost their edge and rotating into newly-attractive names — but the transition takes time, and during that time the portfolio carries the residual drag from a sector that benefited the strategy enormously through 2025.
Model Portfolio Performance
A +7.2% monthly gain is a strong absolute result by any standard. The relative shortfall versus the S&P 500 is best understood as the accumulated effect of two months: the model gave up more than the index in March’s precious metals correction and then recovered somewhat less in April’s narrowly-led rebound. Year-to-date, however, the portfolio is still +2.1 percentage points ahead of the S&P 500, and since inception alpha stands at +38.9 percentage points.
Return Results (as of Apr 30, 2026):
Total return (14 months): +63.5%
S&P 500 return (same period): +24.6%
Alpha generated: 38.9 percentage points
Annualized return: 52.4% (vs. 20.8% for S&P 500)
Monthly beats: 10 of 14 months (71%)
Quarterly beats: 5 of 5 quarters (100%)
Realized Trades (since inception):
Win rate: 56% of 101 trades (57 winners, 44 losers)
Average return: 17.4% (winners: +45.5%, losers: -19.1%)
Average days held: 144.5 days
Realized multibaggers: 6 (the latest a gold miner realized on April 27 at +209% — the second-largest realized trade in portfolio history)
Risk-Adjusted Metrics (since inception):
Beta: 0.64
Sharpe Ratio: 2.15 (vs. 1.00 for S&P 500)
Sortino Ratio: 2.53 (vs. 1.46 for S&P 500)
Maximum Drawdown: -13.83% (vs. -16.19% for S&P 500)
The maximum drawdown remained at -13.83% through April, with the portfolio recovering steadily from March’s lows without setting new troughs. The Sharpe Ratio of 2.15 continues to reflect strong risk-adjusted returns, more than double the benchmark’s 1.00. Importantly, the portfolio’s maximum drawdown remains shallower than the S&P 500’s worst peak-to-trough decline over the same period — a meaningful demonstration of downside resilience even after the most challenging months since inception.
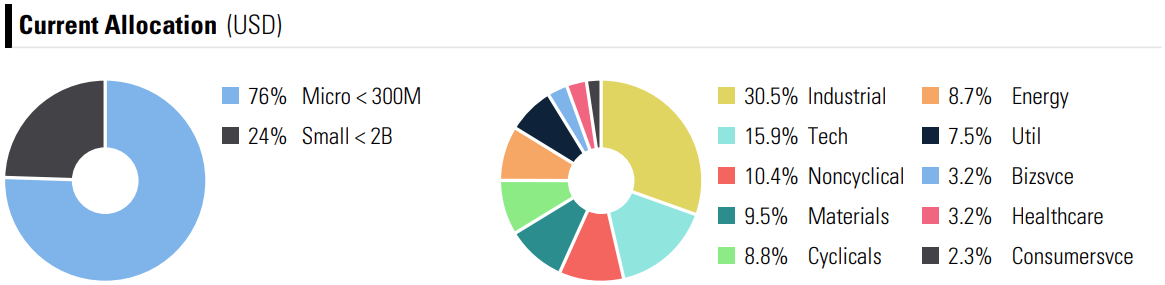
Current allocation is now spread more broadly across sectors than at any point this year. Industrials lead at 30.5%, followed by Technology at 15.9%, Consumer Non-Cyclicals at 10.4%, Materials at 9.5%, Consumer Cyclicals at 8.8%, and Energy at 8.7%. Microcaps continue to dominate at 76% of the portfolio, with small caps making up the remaining 24%.
Deep-Dive Stock Performance
April was a recovery month for the deep-dive selection, with most positions regaining ground after March’s correction. The average return across all eight active positions held steady at +55%, essentially unchanged from March despite the volatility of the past two months. Serabi Gold joined APM and Mineros as the third multibagger on the list.
Deep-Dive Summary
Total positions: 8
Average return: +55%
Average holding period: ~8 months
Multibaggers: 3 of 8 (APM, MSA, SRB)
The three publicly available deep-dives (APM, MSA, and SRB) remain accessible to all subscribers — you can find them in the deep-dives section.