

On February 27th, 2025, I launched The Alpha Engineer model portfolio with a straightforward thesis: a disciplined, systematic process of buying and selling stocks based on a sound and thoroughly back-tested and live-tested multi-factor ranking that engineers alpha. The model uses factors that work in markets on both sides of the Atlantic, grounded in sound principles including value, momentum, and quality. One year later, the results speak for themselves. The portfolio has returned +71.5% versus +18.6% for the S&P 500 — outperforming by 52.9 percentage points in its first twelve months. A $10,000 investment at inception would now be worth $17,150, compared to $11,860 in the S&P 500.
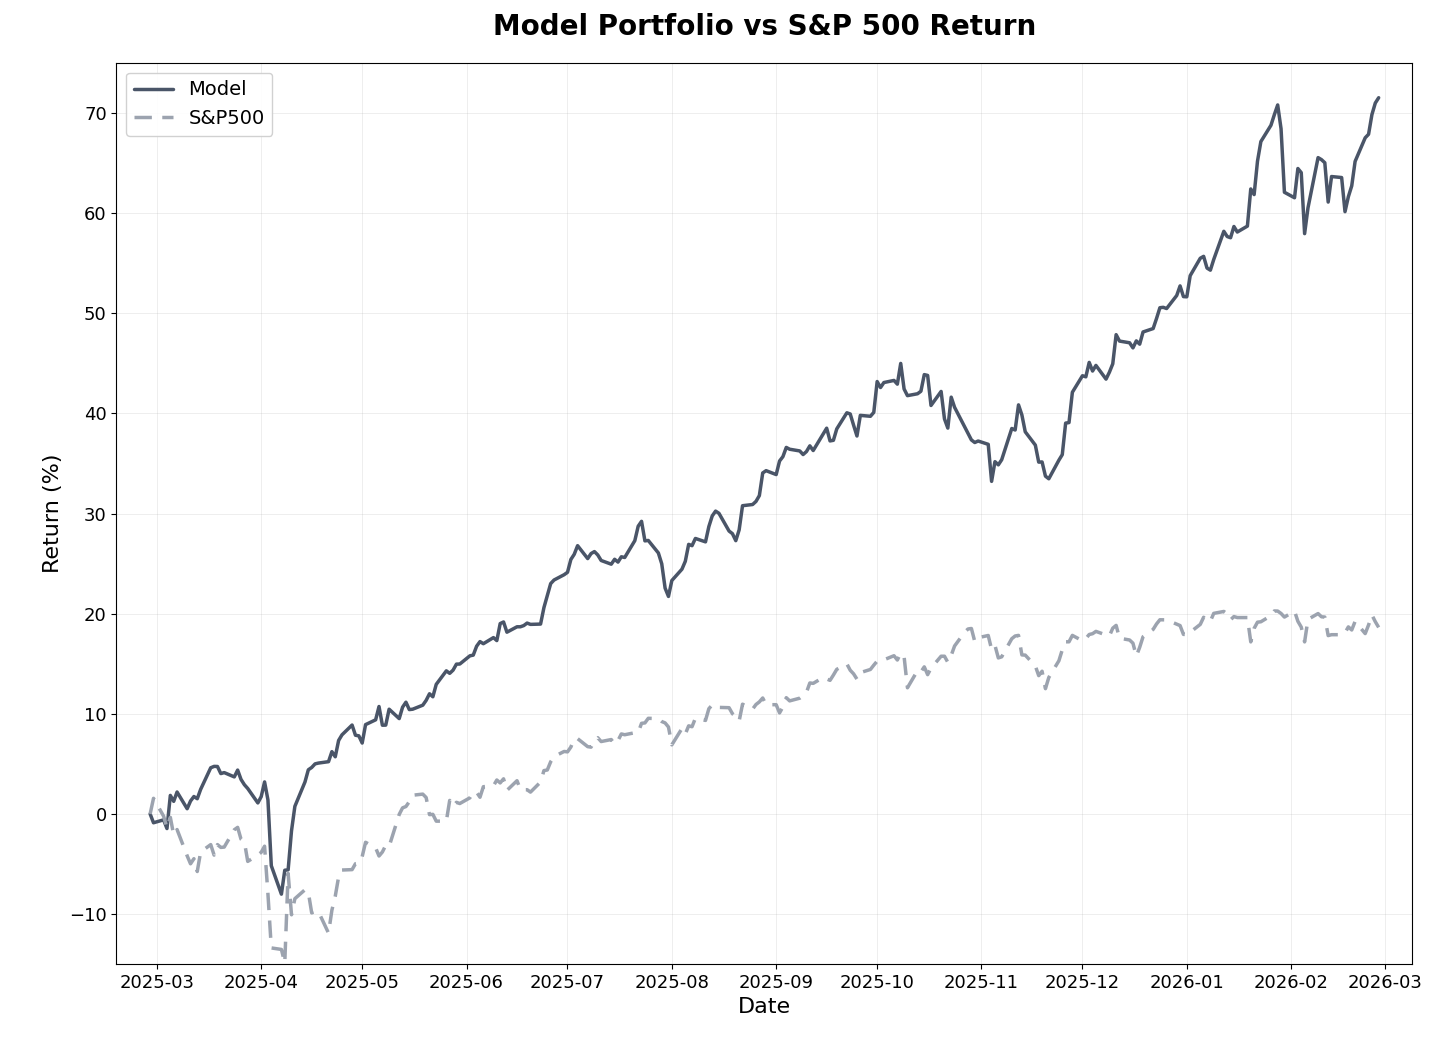
The model has beaten the benchmark in 10 of 12 months (83%) and in all five quarterly periods since inception, including the only down quarter for the S&P 500. With a Sharpe Ratio of 3.80 versus 1.31 for the benchmark and a maximum drawdown of -12.2% versus -16.2% for the index, the portfolio has delivered strong absolute returns with superior risk-adjusted performance.
February itself added another strong chapter. The model generated +5.8% while the S&P 500 declined -0.9%, an excess return of +6.7% for the month. Year-to-date, the portfolio is now up +13.1% versus just +0.6% for the benchmark. This month also brought a new deep-dive stock and some notable market developments including the Supreme Court striking down IEEPA tariffs on February 20th.
The deep-dive stocks continue to deliver. The average return across all eight positions now stands at +108%. The four deep-dives published in the first six months average +217%, with three of those now multibaggers. Three of the four recent healthcare positions remain near their entry points, and with geopolitical tensions and tariff uncertainty continuing to drive market volatility, the coming weeks may offer attractive entry opportunities as key catalysts approach. The fourth received significant pipeline news today that will require a reassessment — paid subscribers will find a full update below.
Markets in February
February was a turbulent month shaped by a landmark Supreme Court decision, renewed tariff uncertainty, and a deepening rotation away from mega-cap technology stocks. The S&P 500 finished the month down approximately -0.9%, its worst monthly performance since March. The Dow held up somewhat better, while the Nasdaq dropped roughly -3% as AI-related concerns weighed on the sector.
The dominant event was the Supreme Court’s 6-3 ruling on February 20th that the International Emergency Economic Powers Act (IEEPA) does not authorize the president to impose tariffs. The decision struck down the sweeping reciprocal tariffs imposed in 2025, estimated to have raised over $160 billion from U.S. importers. Markets initially rallied on the ruling before giving back gains as President Trump responded within hours by imposing new 10% global tariffs under Section 122 of the Trade Act of 1974, effective February 24th. This replacement authority expires after 150 days unless Congress votes to extend it, injecting further uncertainty heading into the midterm election season. Markets ended the week lower after a hotter-than-expected producer price index report on the final trading day added sticky inflation to the list of investor concerns.
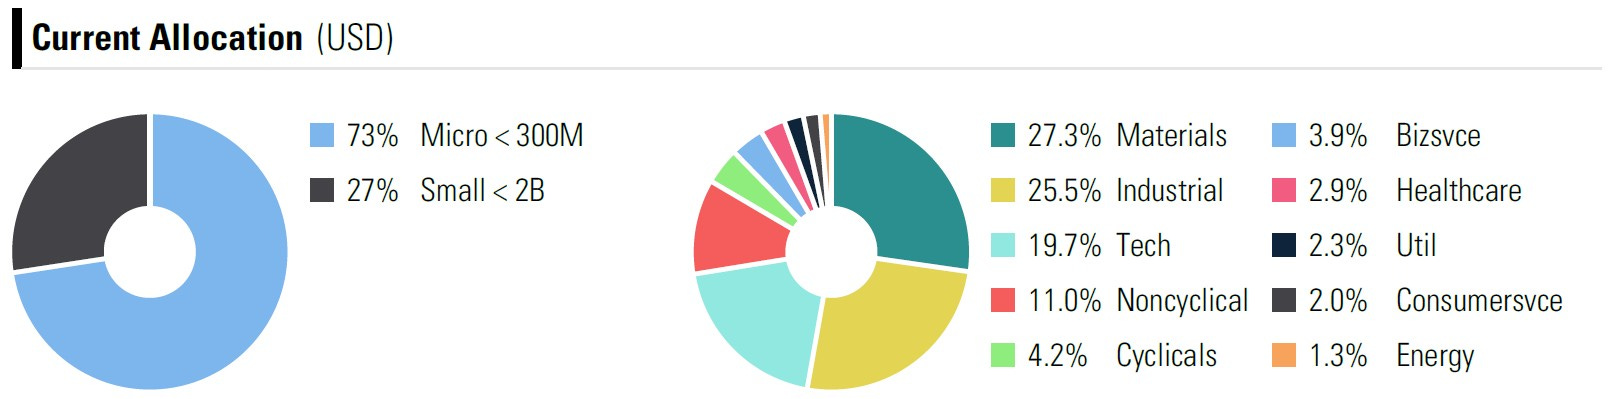
The small-cap renaissance that began in January continued to gain momentum. Small-cap stocks outperformed large caps by approximately 4 percentage points in the first six weeks of the year, driven by a narrowing valuation gap, improving small-cap earnings growth (projected at 18-22% for the full year versus 13% for large caps), and the beneficial effects of the Federal Reserve’s rate cuts in late 2025. The sector rotation is notable: energy, materials, and consumer staples are leading the S&P 500 in 2026, while technology lags. This environment plays directly into the model portfolio’s strengths, with its concentration in microcaps (73%), small caps (27%), and heavy weightings in materials (27.3%) and industrials (25.5%).
Gold prices remained elevated throughout February, trading between approximately $4,900 and $5,200 per ounce. After January’s sharp spike above $5,500 and subsequent correction, February saw a more orderly consolidation with gold ending the month around $5,275. The precious metal is now up over 75% since early 2025, driven by persistent central bank buying (863 tonnes in 2025), geopolitical uncertainty, and expectations of further Fed rate cuts. The portfolio’s precious metals exposure, led by APM at 8.7% and GG at 8.8% of the portfolio, continues to benefit from this structural tailwind.
Model Portfolio Performance
February marked another month of meaningful outperformance, with the model generating +5.82% versus -0.86% for the S&P 500 — an excess return of +6.69% for the month.
Return Results (as of Feb 27, 2026):
Total return (12 months): 71.5%
S&P 500 return (same period): 18.6%
Alpha generated: 52.9 percentage points
Monthly beats: 10 of 12 months (83%)
Realized Trades (since inception):
Win rate: 54% of 84 trades (45 winners, 39 losers)
Average return: 12.4% (winners: +38.8%, losers: -18.0%)
Average days held: 126 days
Portfolio turnover: 119% annualized
Realized multibaggers: 4 (MSA +184%, BKTI +165%, AAC +126%, NELLY +102%)
Risk-Adjusted Metrics (since inception):
Beta: 0.24
Sharpe Ratio: 3.80 (vs. 1.31 for S&P 500)
Sortino Ratio: 4.86 (vs. 1.70 for S&P 500)
Maximum Drawdown: -12.2% (vs. -16.2% for S&P 500)
The Sharpe Ratio of 3.80 and Sortino Ratio of 4.86 remain exceptional after a full year of live trading. This is live performance with 1% transaction and slippage costs applied to every trade. The portfolio’s low beta of 0.24 demonstrates that the majority of returns come from stock-specific selection rather than broad market exposure.
February saw the realization of the MSA (Mineros SA) position from the model portfolio, closing on February 23rd at a +184% return over 266 days. This was the single best realized trade in the portfolio’s history.
The portfolio currently holds five multibaggers — APM (+641%), GG (+417%), BYGGP (+189%), PXM (+123%), and WAS (+107%) — with several other positions showing strong returns. Combined with four realized multibagger trades, the model has produced nine multibaggers in its first year. This consistent ability to capture outliers across different sectors and geographies is precisely why the top of the ranking serves as the primary hunting ground for my deep-dive stock selection. As of the end of February, the two largest positions remain precious metals miners: GG (Golconda Gold) at 8.8% and APM (Andean Precious Metals) at 8.7%.
Deep-Dive Stock Performance
A new position was added in February (see deep-dive).
Deep-Dive Summary
Total positions: 8
Average return across all 8 positions: +108%
Multibaggers: 3 of 8 (APM, MSA, SRB)
The three multibagger deep-dives (APM, MSA, and SRB) are available to all subscribers — you can find them in the deep-dives section.