

Some subscribers have asked how I actually build and test quantitative strategies. While most prefer using The Alpha Engineer rankings directly, a few have the engineering curiosity to explore model-building themselves.
In my article Engineering Alpha, I covered the philosophy behind systematic investing—why an engineering mindset works, how to think about factors, and the general process of developing a quantitative approach. This article is an introduction to Portfolio123, the platform I use to build and test my quantitative models.
Fair warning: this process takes significant time and effort to master. But understanding it will make you a better investor regardless of whether you build your own model or leverage mine.
The Building Blocks: Universes and Ranking Systems
Portfolio123 organizes quantitative model development around two core components: universes and ranking systems. Master these, and you have the foundation for systematic investing.
Universes: Defining Your Hunting Ground
A universe defines which stocks your model will consider. This sounds simple, but it’s where many DIY quants make their first mistake—starting too narrow and missing opportunities, or too broad and drowning in noise.
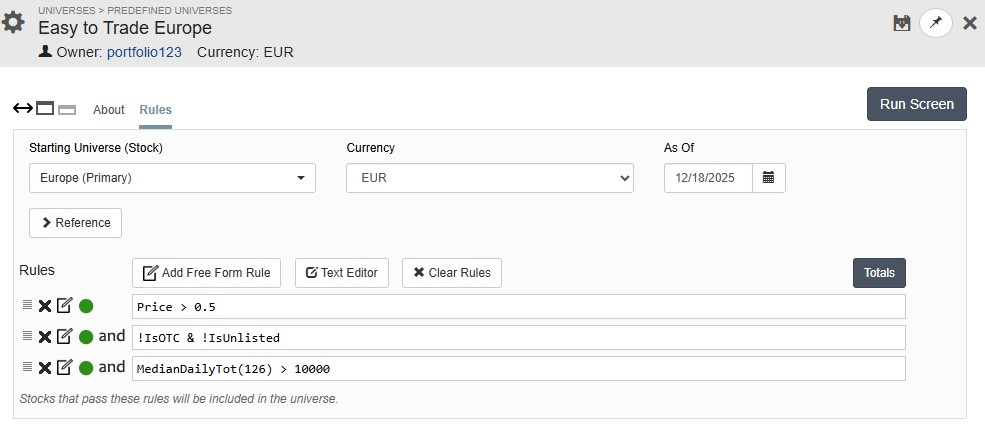
Portfolio123 lets you build universes using filters across multiple dimensions. You can filter by country (US, Canada, Europe, UK), exchange (NYSE, NASDAQ, TSX, LSE…), sector, industry, and market cap. But the real power comes from adding quality constraints that eliminate stocks likely to cause problems.
Two examples:
No OTC stocks: These trade outside major exchanges with limited liquidity and limited reporting standards
No penny stocks: Stocks under $1 (or $0.5) face higher delisting risk, have higher bid spreads and may attract manipulation
The universe definition is where you balance opportunity against practicality. Define it too broadly and your model fills with untradeable stocks. Define it too narrowly and you miss the inefficient corners where alpha lives.
Ranking Systems: Testing Your Hypotheses
The ranking system is the core engine of quantitative investing. This is where you translate investment hypotheses into testable, systematic rules.
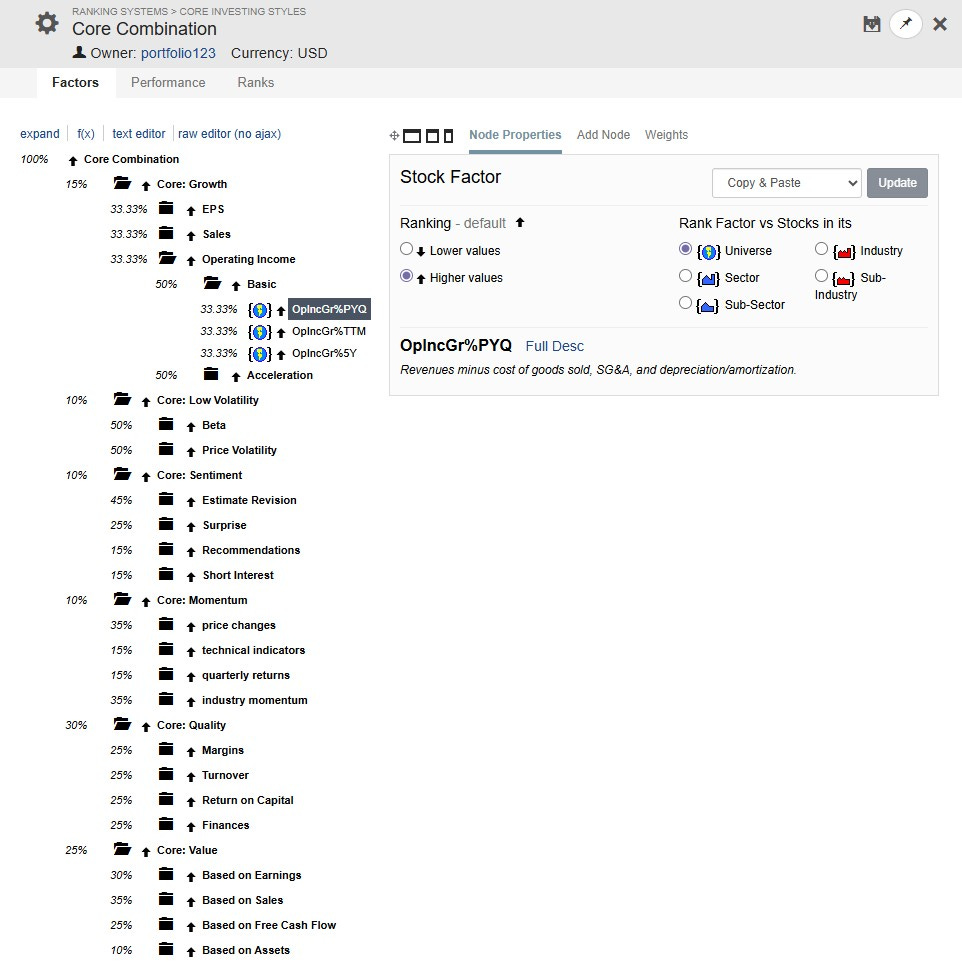
A ranking system combines multiple factors such as value metrics, momentum indicators and quality measures. It assigns each stock in your universe a composite score. Portfolio123 lets you weight factors, create custom formulas, and test how different combinations perform.
The process typically works like this:
Start with a hypothesis (e.g., “stocks with high EPS growth during the last quarter outperform”)
Define the factor mathematically
Test that single factor against your universe over multiple time periods
Observe whether top-ranked stocks outperform bottom-ranked stocks
Combine successful factors into a composite ranking
Test the combined ranking against individual factors
What separates rigorous quant research from data mining is this: factors should make intuitive sense AND show statistical significance across different periods. A factor that only worked from 2010-2015 isn’t a discovery—it’s probably noise.
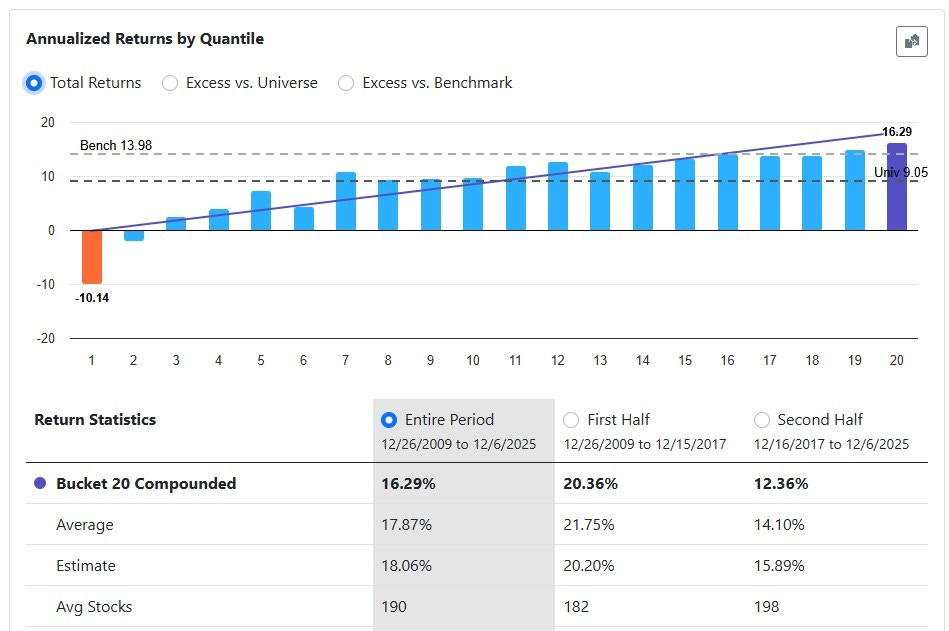
Portfolio123’s ranking system tools let you see performance by bucket—deciles (top 10%, next 10%, etc.), or any size you choose (1%, 5%, etc.)—which reveals whether a factor truly differentiates winners from losers or just identifies extremes.
Testing Your Model: Simulations and Live Strategies
Once you have a universe and ranking system, the bucket tests show whether your factors generate returns. But simulations and live strategies let you see what to expect in a real portfolio—with position sizing, rebalancing, and transaction costs. Portfolio123 provides two approaches: simulated strategies (backtests) and live strategies.
Simulated Strategies: Backtesting Your Approach
A simulated strategy takes your ranking system and tests it as if you had traded it historically. You define the rules—how many stocks to hold, when to buy, when to sell—and Portfolio123 calculates what your returns would have been.
Some key parameters you’ll configure:
Number of holdings: 20, 50, 100 stocks? More holdings reduce volatility but dilute alpha and increase portfolio management
Rebalancing frequency: Weekly, monthly, quarterly? More frequent could mean higher return but also higher turnover and portfolio management
Buy rules: Minimum rank to purchase, liquidity thresholds, maybe sector limits for diversification…
Sell rules: Rank drops below a threshold, holding period limits, special situations (e.g. merger)…
The sell rules deserve special attention. Many DIY quants focus obsessively on what to buy but treat selling as an afterthought. In my experience, disciplined selling matters as much as stock selection. A rank-based sell rule (e.g., sell when a stock falls below the top 10%) systematically removes deteriorating positions.
Portfolio123 includes realistic transaction cost modeling which is essential for strategies involving small-cap or micro-cap stocks where spreads can be significant.
The Backtesting Trap
Here’s where I must be direct: backtesting is seductive and dangerous. It’s trivially easy to build a model that shows 50% annual returns over the past decade. It’s extremely hard to build one that continues working going forward.
The problem is overfitting. Every backtest is an in-sample test—you’re using historical data to find patterns, then measuring performance on that same data. With enough parameters to tweak, you can always fit past data. The model learns the noise, not the signal.
Signs you’ve overfit:
Performance looks too good to be true (it probably is)
Results are sensitive to small parameter changes
Factors don’t have intuitive explanations
High-frequency trading with unrealistic cost modeling—massive returns evaporate once you account for real spreads and slippage
This is why out-of-sample testing matters so much. Out-of-sample means testing on data your model hasn’t seen during development—either through live testing (tracking performance going forward) or backtesting on periods you deliberately excluded from your optimization. Both approaches help reveal whether your model found real patterns or just memorized historical noise.
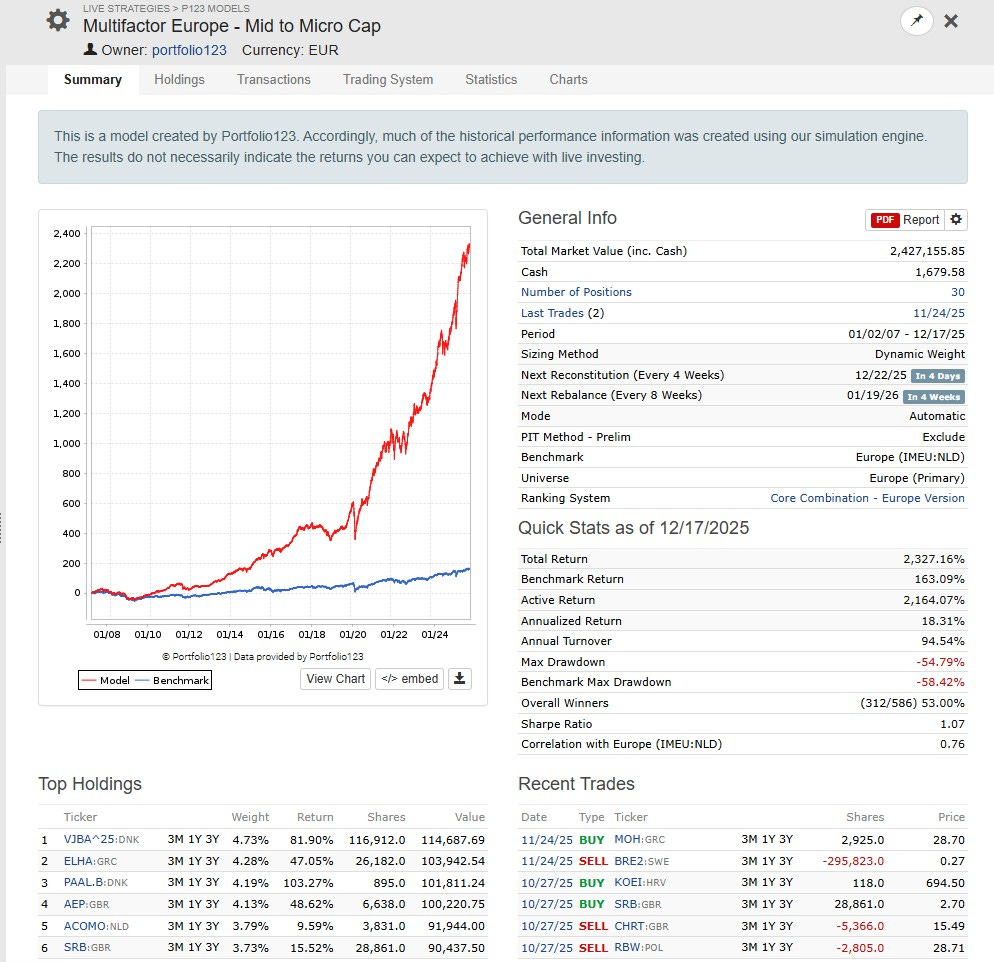
Live Strategies: Proving Your Model in Real Time
A live strategy tracks your model’s performance in real-time, going forward. No hindsight, no curve-fitting—just your model meeting the market as it unfolds. You still need to model transaction costs and slippage realistically—live testing doesn’t eliminate that requirement, it just removes the hindsight bias.
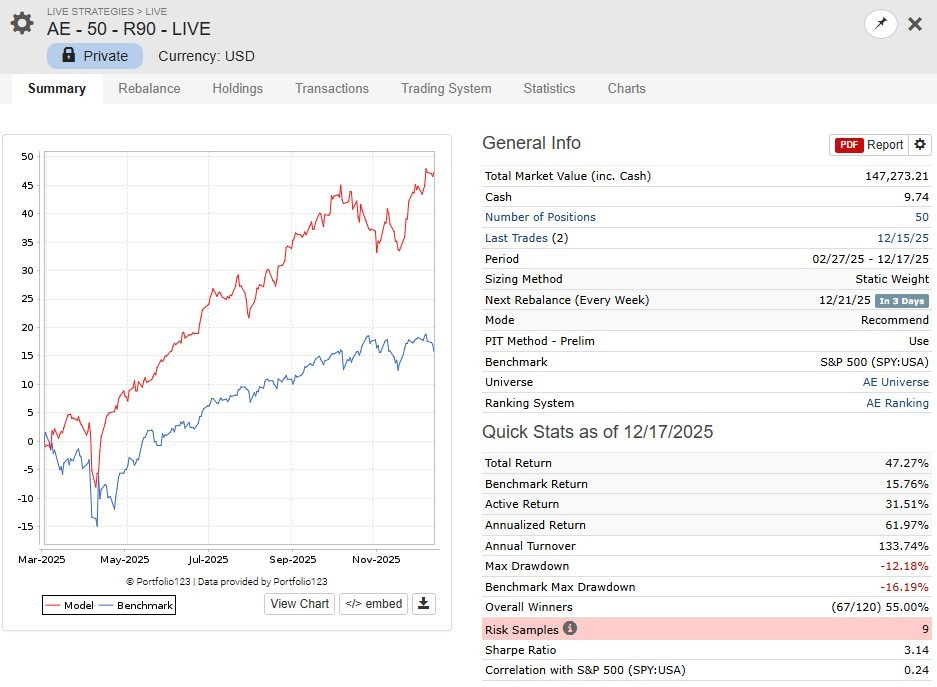
Portfolio123 lets you run paper portfolios that track what your model would recommend each period (week, month…). These results accumulate over time, building a genuine track record.
Live testing is uncomfortable. Your model will underperform for stretches. Individual picks will blow up. You’ll question every design decision. This discomfort is the point—it’s what separates real edges from backtested fantasies.
Advanced Tools: Rolling Tests and Optimization
Portfolio123 includes tools that help you stress-test your model beyond simple backtests.
Rolling Tests: Checking for Luck
A single backtest uses one starting date. But what if you were lucky with that specific start? Seasonality, quarterly patterns, and monthly fluctuations all affect results. Starting your simulation at a market peak could overstate your expected returns.
Rolling tests address this by running your simulation multiple times with different start dates. Instead of one 15-year backtest, you get dozens of overlapping backtests that reveal how consistent your model’s performance really is.
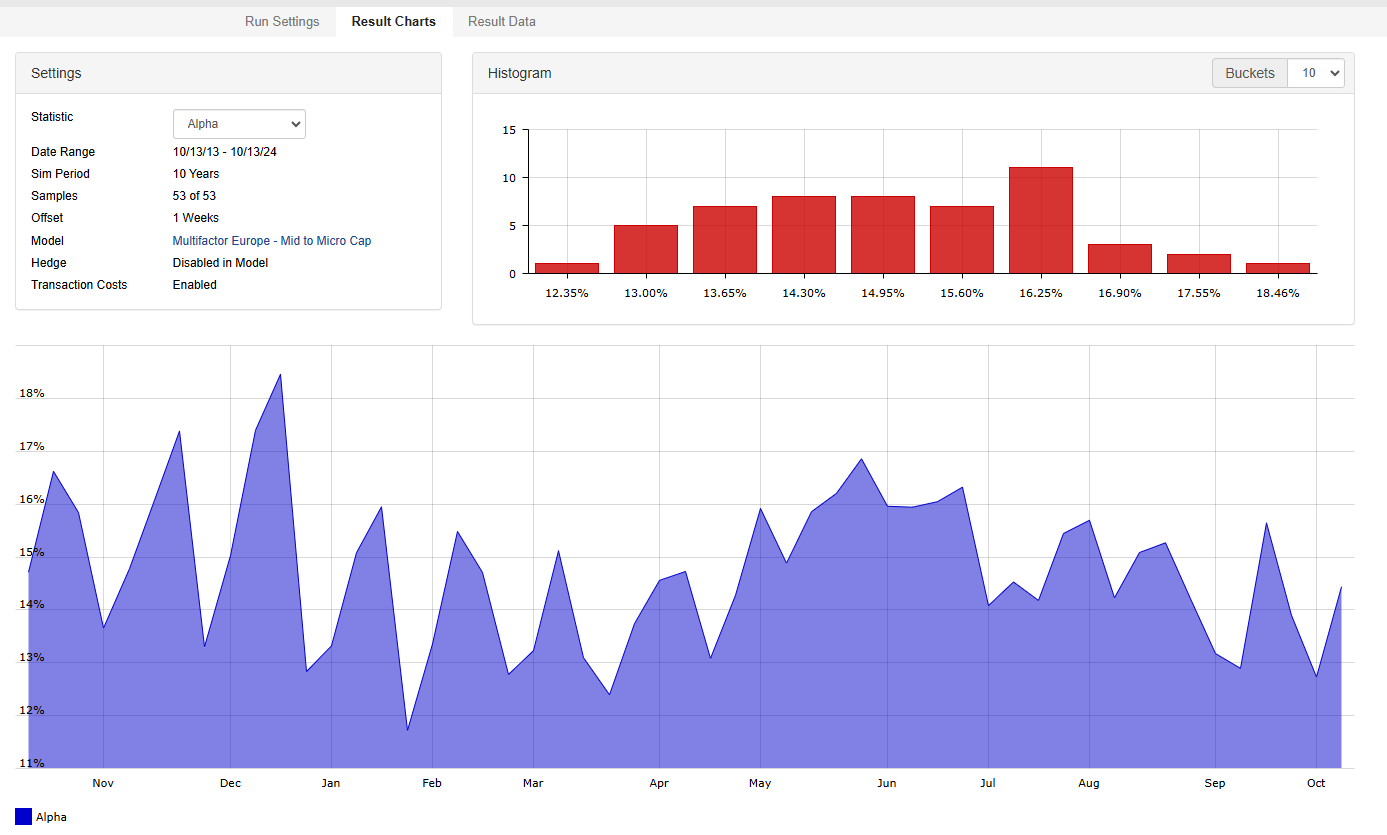
One way to reduce timing sensitivity is using weekly rebalancing—more frequent transactions smooth out the impact of any single entry point. But even then, rolling tests help you verify that performance variations across different start dates aren’t significant. Robust strategies show relatively consistent results regardless of when you begin measuring.
The Optimizer: Handle with Extreme Caution
Portfolio123 includes an optimization tool that automatically searches for the best parameter values—factor weights, buy & sell rules, universe filters—to maximize historical returns.
I use this tool sparingly, and you should too.
The optimizer allows you to find the parameter combination that would have worked best in the past. The problem is that you want to let it work in the future. You may overfit if you over do this.
If you use the optimizer at all:
Optimize on one time period, test on a completely separate period
Use it to understand sensitivity, not to find “perfect” parameters
Prefer simple models with few parameters over complex models that are at risk of overfitting
Be deeply suspicious of optimized results that look dramatically better than unoptimized ones
The goal is out-of-sample performance—returns on data your model has never seen. Optimization, by definition, improves in-sample results at the risk of degrading out-of-sample performance.
For The Alpha Engineer model, I deliberately limited tuning. Because I built the model using factors with established research backing their individual performance, I used the optimizer mainly to check robustness—not to find better parameters. The model didn’t require changes after the initial build using the ranking tool. I also tested the final model on an out-of-sample period of several years before starting the live test—giving me two layers of validation beyond the initial backtest. That combination—proven factors, out-of-sample backtesting, and live testing—is what gave me confidence to deploy real capital.
The Reality Check
If you’ve read this far, you understand why quantitative model development is genuinely difficult. Building a universe, designing factors, combining them into rankings, backtesting with realistic costs, running live tests, checking robustness—each step requires careful thought and significant time.
Most DIY attempts fail. Not because the people aren’t smart, but because:
They underestimate the data requirements (garbage in, garbage out)
They overfit to historical patterns that don’t repeat
They lack the discipline to follow systematic rules when they’re uncomfortable
They give up during inevitable drawdown periods
This is precisely why The Alpha Engineer exists. I’ve spent years building and testing models, making mistakes, and refining the approach. Subscribers get the output—weekly rankings, model portfolio, clear methodology—without needing to replicate the development process. Publishing for subscribers keeps me disciplined too—I follow the model myself, in good times and bad.
Getting Started with Portfolio123
For those determined to explore model-building, Portfolio123 is the best platform available to individual investors. Institutional tools cost tens of thousands annually. Portfolio123 provides comparable capabilities at a fraction of the cost.
What makes it valuable:
20+ years of point-in-time data: Prevents look-ahead bias that corrupts backtests
Global coverage: U.S., Canada, Europe, with Asia coming soon
Sophisticated ranking tools: Build complex multi-factor models
Realistic simulation: Transaction costs, slippage, liquidity constraints
Live tracking: Monitor real-time performance without risking capital
Get a 35-day free trial using my referral link – Full access to explore the platform and test strategies.
The trial gives you enough time to build a basic universe, create a ranking system, run backtests, and understand whether model development is something you want to pursue seriously.
Two Paths Forward
After exploring Portfolio123, you’ll likely reach one of two conclusions:
Path 1: “This is fascinating—I want to go deeper.” Great. You now have professional-grade tools to develop your own systematic approach. Expect the learning curve to take months, not weeks. Start simple. Test rigorously. Be humble about what backtests can tell you.
Path 2: “This confirms I’d rather leverage someone else’s work.” Also great. Understanding the process makes you a more informed user of quantitative strategies—including The Alpha Engineer rankings. You’ll better appreciate why systematic approaches work, how to interpret rankings, and why discipline matters.
Either path makes you a better investor. That’s the real value of understanding how quant models are built.
The Alpha Engineer — Investing with a quantitative edge
Disclaimer: The Alpha Engineer shares insights from sources I believe are reliable, but I can’t guarantee their accuracy—data’s only as good as its inputs! This content (whether on Substack, via email newsletters, X, or elsewhere) is for informational and educational purposes only—it’s not personalized investment advice. I’m not a registered investment advisor, just an engineer crunching numbers for alpha. My opinions are my own and may shift without notice. Investing involves risks, including the chance of losing money. Past performance, whether from back-testing or historical data, does not guarantee future results—outcomes can vary. So, please consult your financial advisor to see if any strategy fits your situation. Full disclosure: I may own positions in the securities I mention, as I actively manage my own portfolio based on these strategies.